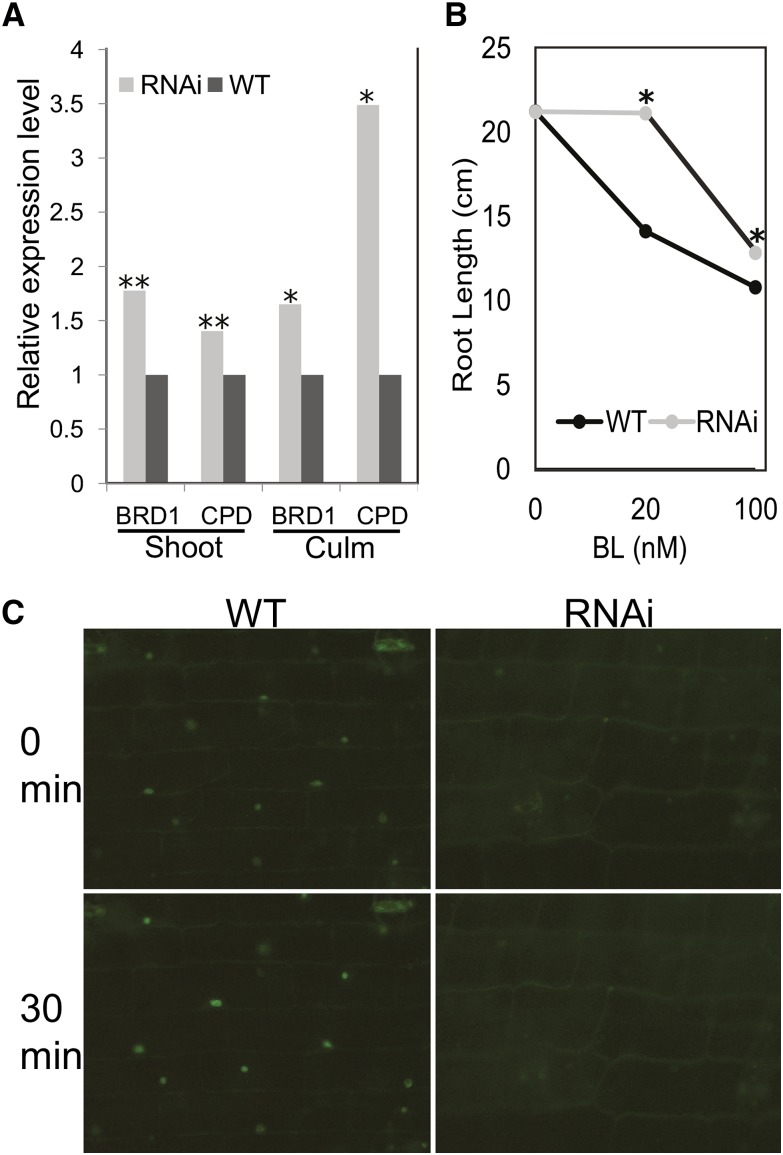
Figure 2.
zmbri1-RNAi plants have disrupted BR signaling. A, BR marker gene expression in strong zmbri1-RNAi plants. Tissue was collected from 40-d-old plants when phenotypes were clearly exhibited and the most strongly affected portions of the plants were developing. Shoot tissue included culm, meristem, and growing regions of leaves from approximately the seven youngest plastochrons. Culm tissue included node and internode tissue from the same stage. Bars show proportional expression of genes in RNAi lines over wild-type (WT) siblings, with gene expression set to 1 in the wild type. Student’s t test P values: *, P < 0.05; and **, P < 0.01. B, BL root growth inhibition assay. Points show root length in cm of BL-treated roots versus mock-treated roots. The asterisk indicates a significant difference between wild-type and RNAi seedlings at P < 0.05 by Student’s t test. C, BES1-YFP expression pattern in wild-type and zmbri1-RNAi leaf sheath tissue. In the wild type, BES1-YFP accumulation in nuclei of leaf sheath cells could be induced to higher levels by BL application. The zmbri1-RNAi cells showed decreased BES1-YFP nuclear expression in untreated tissue and a slower response to exogenous BL treatment.

