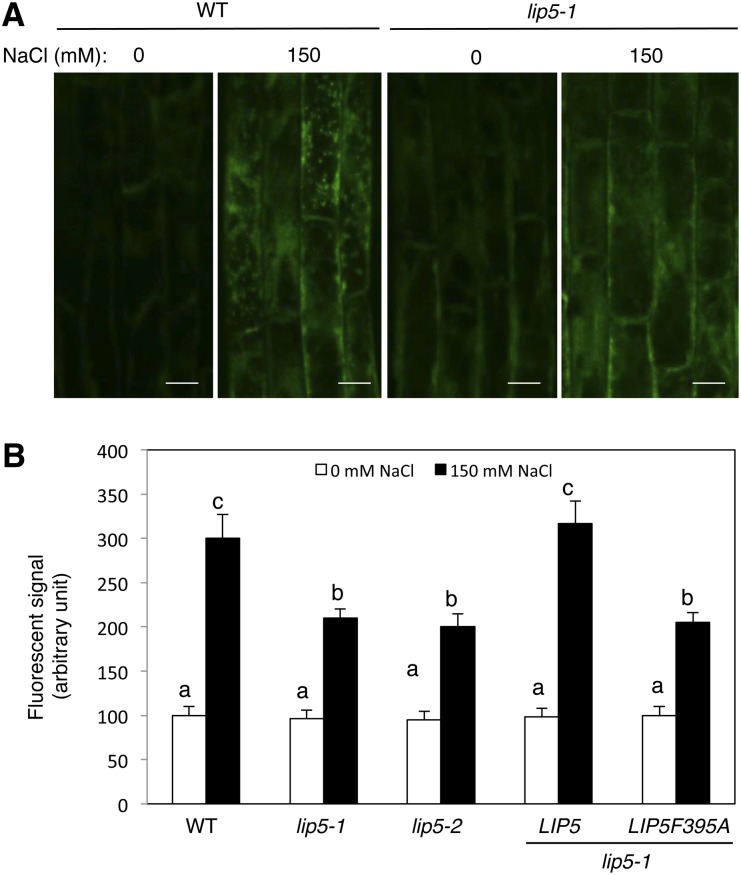
Figure 6.
Compromised ROS production under salt stress in the lip5 mutants. Five-day-old seedlings were treated with 0 or 150 mm NaCl for 20 h. ROS levels were analyzed using H2DCFDA staining. A, Representative confocal images of Arabidopsis root epidermal cells of the wild type (WT) and the lip5-1 mutant after H2DCFDA staining. Bars = 100 μm. B, Signal intensity of H2DCFDA in stained Arabidopsis root epidermal cells of the wild type, lip5-1, lip5-2, and transgenic lines. Means and se were calculated from images of 10 independent roots (more than 20 images per root). According to Duncan’s multiple range test (P = 0.05), means do not differ significantly if they are indicated with the same letter.

