Figure 7.
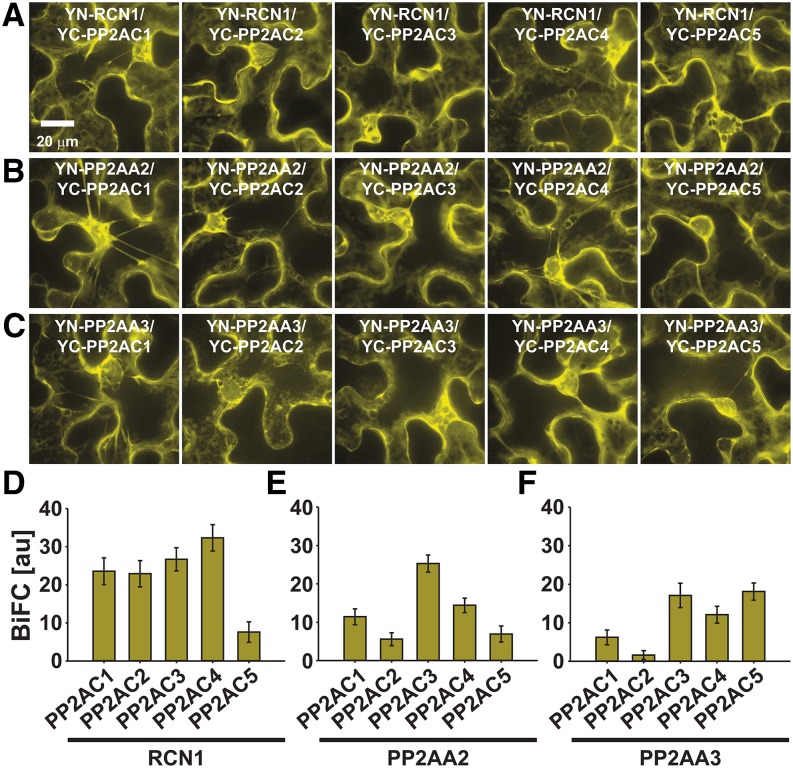
Regulatory PP2AA subunits interact with catalytic PP2AC subunits in BiFC analyses. A and D, BiFC analyses of YN-RCN1 with YC-PP2AC1-C5. B and E, BiFC analyses of YN-PP2AA2 with YC-PP2AC1-C5. C and F, BiFC analyses of YN-PP2AA3 with YC-PP2AC1-C5. A to C, High-magnification 32-plane z-stack maximum projections with optimized brightness and contrast showing PP2AA- and PP2AC-subunit complex formations in the cytoplasm. YC, Yellow fluorescent protein C-terminal fragment; YN, yellow fluorescent protein N-terminal fragment. D to F, BiFC quantifications measured from entire low-magnification images, which were acquired using identical settings for each BiFC experiment (means ± sem [n = 10 images]).

