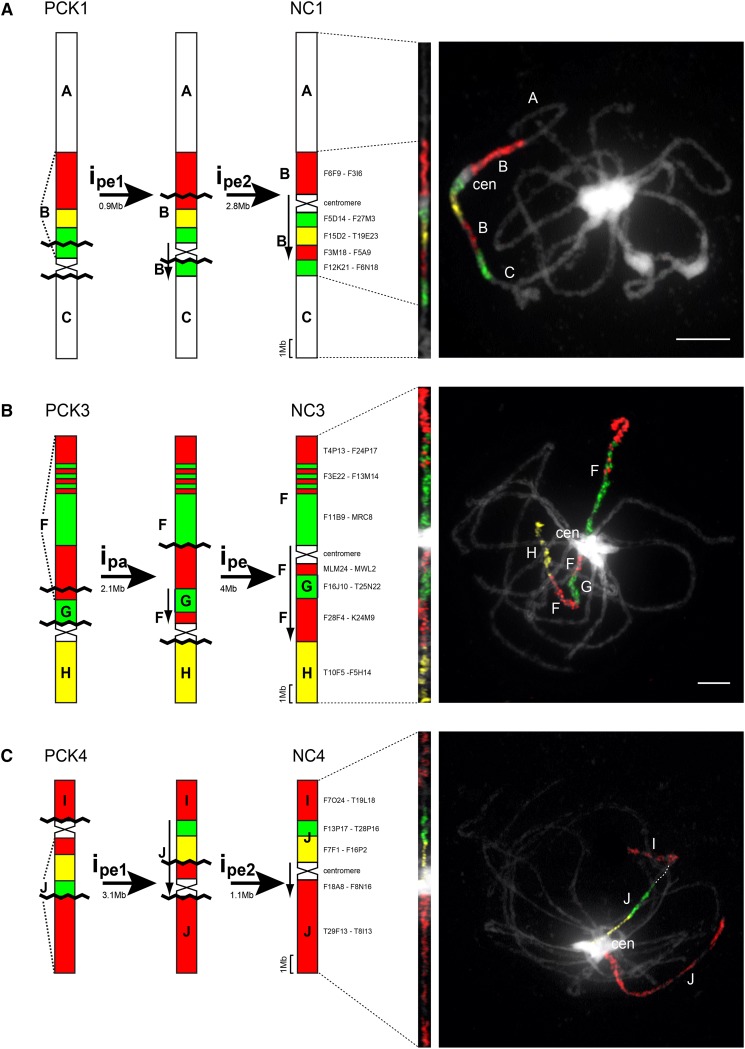
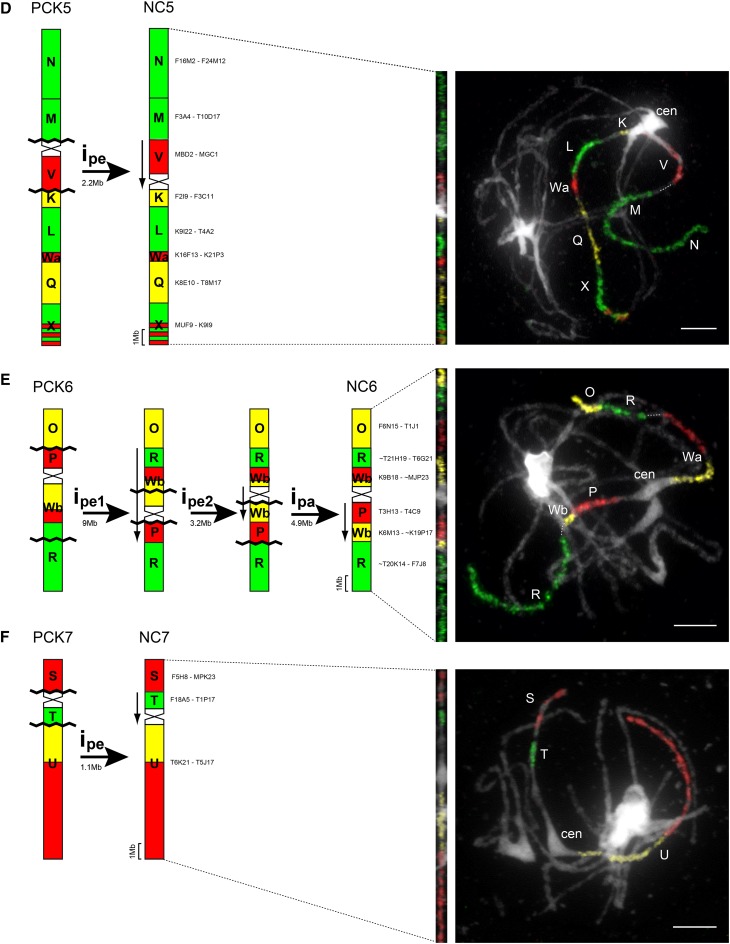
Figure 2.
Inference of chromosome rearrangements during evolution of the N. caerulescens genome from the ancestral PCK genome. Shown are schematic summaries (left) and examples of CCP analysis (right). NC2 retaining the ancestral structure is not shown. ipa, Paracentric inversion; ipe, pericentric inversion. Downward-pointing arrows denote the inverse orientation of chromosome regions after inversions. The approximate size of each inversion was estimated based on the A. thaliana genome sequence (www.arabidopsis.org); rDNA loci were not considered. Chromosomes were painted with A. thaliana BAC contigs labeled by biotin-dUTP (red), digoxigenin-dUTP (green), and Cy3-dUTP (yellow); BAC clone coordinates of each contig used are given. Chromosomes were counterstained by 4′,6-diamidino-2-phenylindole (DAPI). Bars = 5 µm.


