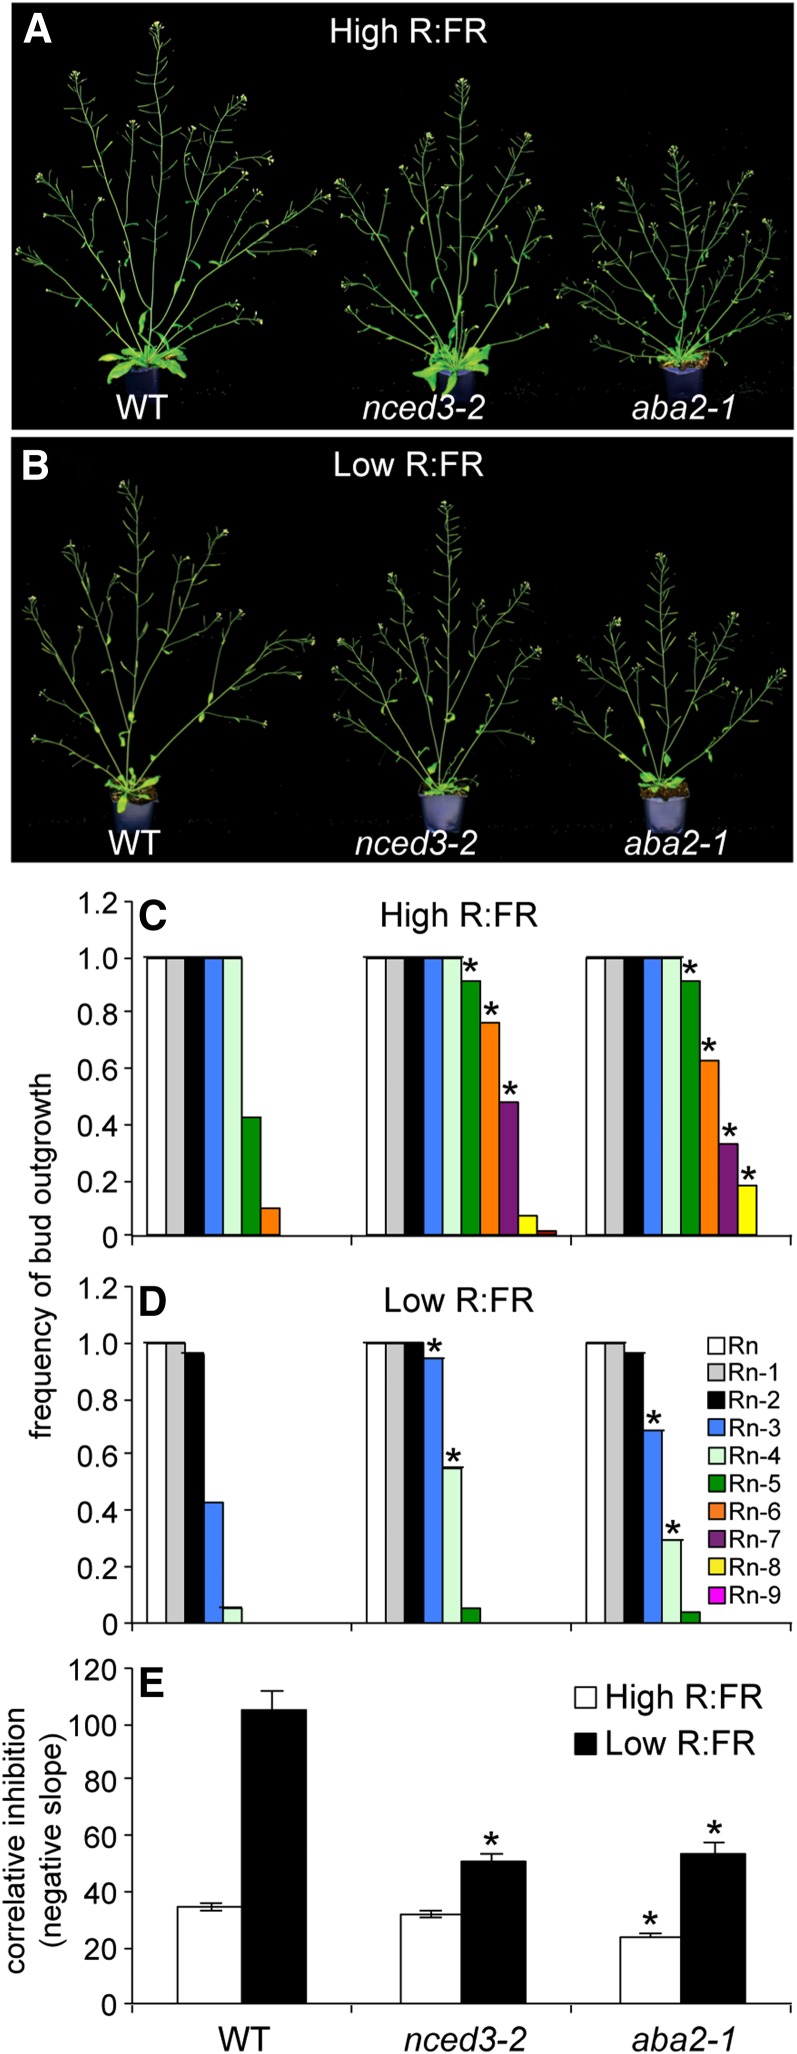
Figure 1.
Visual phenotypes in high (A) and low R:FR (B), frequency of bud outgrowth by bud position in high (C) and low R:FR (D), and correlative inhibition index in high and low R:FR (E) of the wild type (WT), nced3-2, and aba2-1. Rn indicates rosette bud n, the topmost bud. Sequentially lower buds are numbered in order. Data are means ± se with n = 54. Asterisks indicate a significant difference between the wild type and mutants at α = 0.05.

