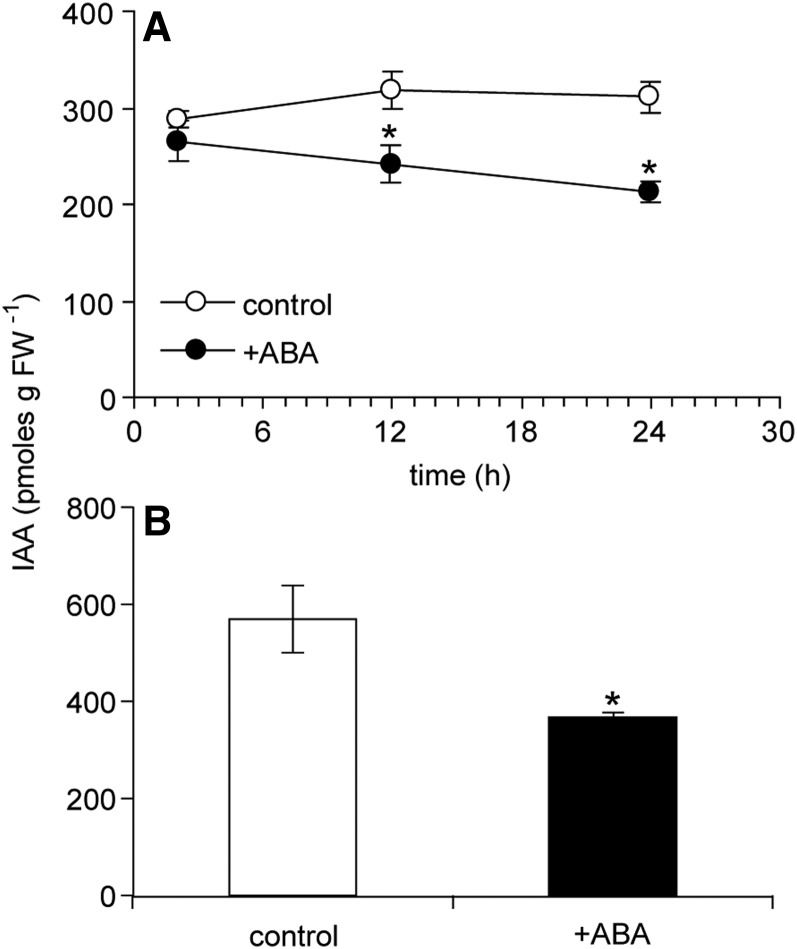
Figure 13.
IAA abundance in unelongated wild-type bud n-2 grown under high R:FR. A, Time course following application of 50 pmol of (+) ABA to distal bud tissues. B, IAA abundance in shoot apices of wild-type bud n-2 24 h after application of 5 pmol of (+) ABA to the bud shoot apical meristem. Data are means ± se with n = 4. Asterisks indicate a significant difference between treated and control tissues at α = 0.05. FW, Fresh weight.

