Figure 7.
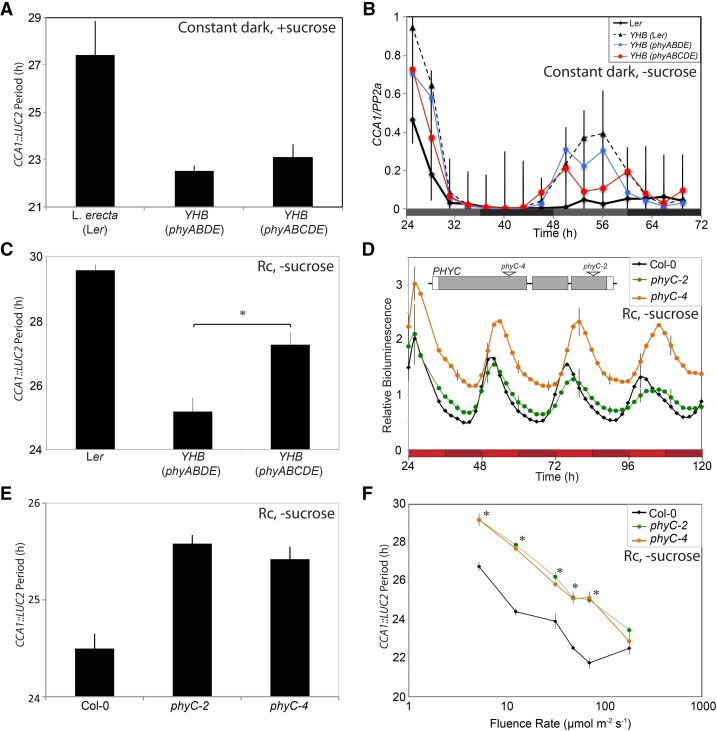
PhyC modulates light input into the circadian system. A, Circadian periodicity of Ler), YHB(phyABDE), and YHB(phyABCDE) seedlings transformed with CCA1::LUC2 after transfer to constant darkness. Plants were grown under 60 μmol m−2 s−1 white light in 12:12 L/D cycles for 6 d with supplemental Suc before being transferred to constant darkness at ZT12. Bioluminescence from groups of five seedlings was pooled for each data point, n > 9. B, Abundance of CCA1 transcripts under constant darkness in YHB(ABDE) and YHB(ABCDE) seedlings using qRT-PCR. Plants were entrained to 12:12 L/D cycles on Suc-free MS medium under 60 μmol m−2 s−1 white light for 10 d before transfer to constant darkness at ZT12. mRNA levels for each gene were normalized to PP2a; sem is shown. C, Circadian periodicity of Ler, YHB(phyABDE), and YHB(phyABCDE) seedlings transferred to dim red light (1 μmol m−2 s−1). Seedlings were grown on 0.5× Suc-free MS medium and entrained for 6 d in 12:12 L/D cycles under 60 μmol m−2 s−1 white light before being transferred to Rc. Bioluminescence from groups of five seedlings was pooled for each data point, n > 7. D, Period estimates of Col-0, phyC-2, and phyC-4 seedlings under Rc. Plants were entrained in 12:12 L/D cycles for 6 d before transfer to 20 μmol m−2 s−1 Rc. The insert shows a schematic illustration of the PHYC locus indicating transfer DNA (T-DNA) insertion locations for phyC-2 and phyC-4. 5′ and 3′ untranslated regions are shown in white boxes, and exons are shown in gray. T-DNA insertion points are indicated with white triangles. E, Period estimates of seedlings transformed with a CCA1::LUC2 reporter. Wild-type (Col-0), phyC-2, and phyC-4 seedlings were entrained as described in (D) before being transferred to 20 μ mol m−2 s−1 Rc. F, Fluence rate response curve to evaluate the effect of phyC on the free-running period of the circadian system. Wild-type (Col-0, black line), phyC-2 (green), and phyC-4 (orange) were entrained as described in D before being transferred to Rc at the indicated fluence rate. sem is shown. *, Significant difference from the wild type (Bonferroni-adjusted Student’s t test).

