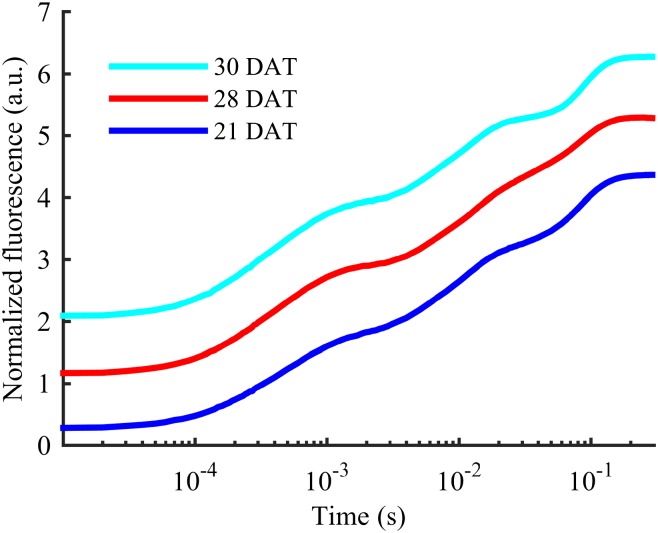
Figure 3.
OJIP transients for the YFDL of a barley plant growing at the lowest level of P supply. Each transient has been offset by 1 arbitrary unit (a.u.) to improve legibility. It is seen that the I step gradually straightens and disappears as plants become increasingly P deficient from 21 DAT (1,200 µg P g–1 DW) to 28 DAT (900 µg P g–1 DW). Two days after plants were resupplied with P at 28 DAT, the I step had reappeared to a control-like state.

