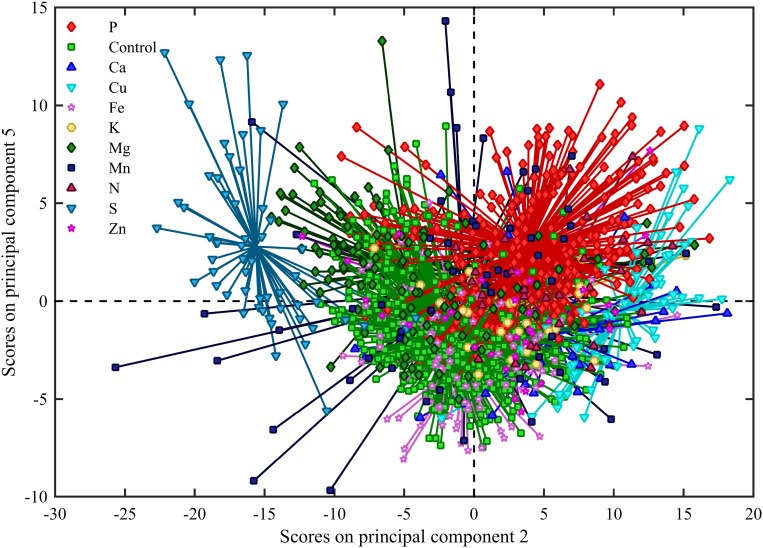
Figure 5.
Score plot showing principal components 2 and 5 derived from a PCA analysis of OJIP transients from both barley and tomato plants with different nutrient deficiencies. Principal components 2 and 5 explained 10.0% and 2.6% of the variance, respectively. P-deficient samples clustered in the first quadrant. S-deficient samples are clustered in the second quadrant, and Cu-deficient samples are also seen to cluster on the border between the fourth and first quadrant.

