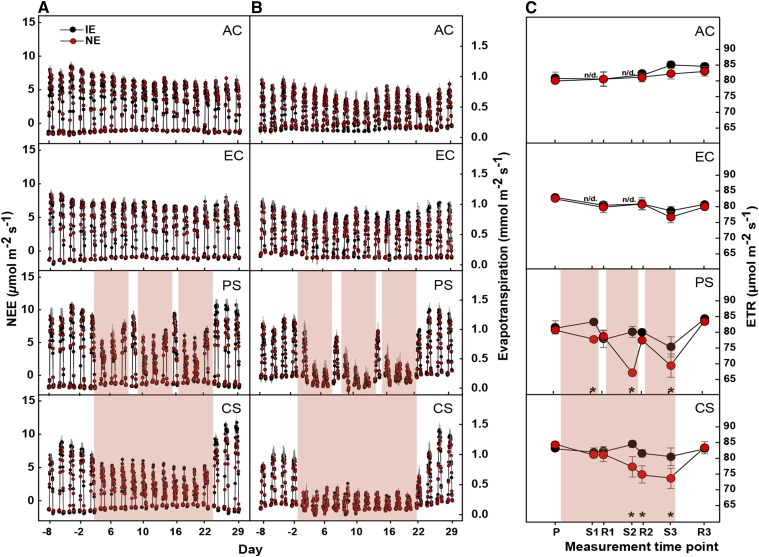
Figure 2.
NEE (A), evapotranspiration (B), and electron transport rate (ETR; C) in IE (black circles) and NE (red circles) poplar genotypes. Plant-level NEE and evapotranspiration values for each scenario are given as hourly means of n = 4 ± se. ETR was measured on leaf 8 below the apex at the indicated time points. HDSs are highlighted in red. Asterisks indicate significant differences (P < 0.05) between IE and NE plants within each scenario (in addition, P values are given in Supplemental Table S1); n/d, no data. The PS and CS scenarios were performed under elevated [CO2].

