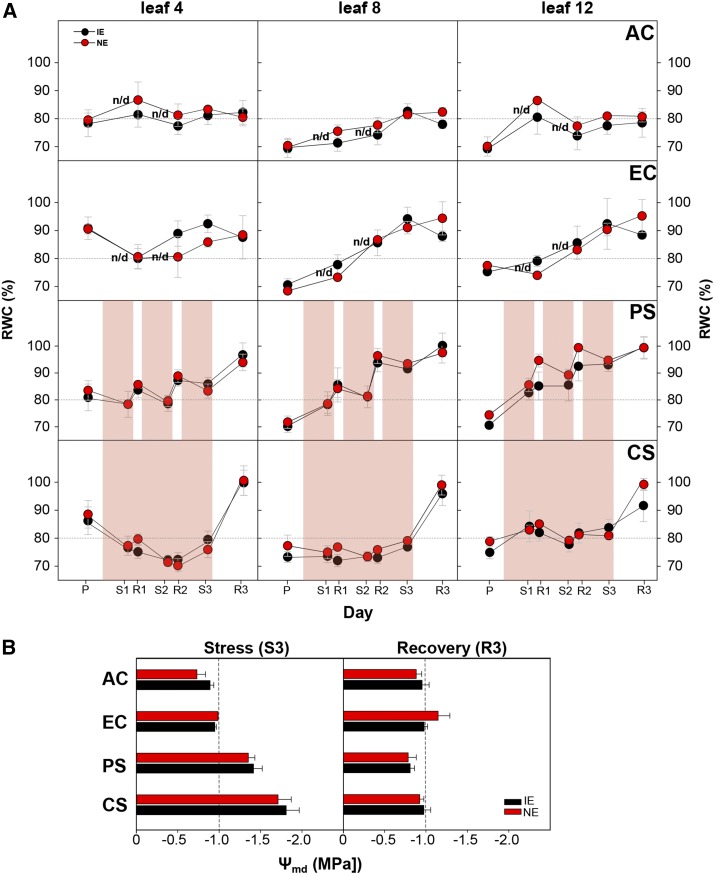
Figure 4.
Plant water status. The effect of four scenarios on the RWC and midday stem water potential (Ψmd) in IE (black symbols) and NE (red symbols) poplars is shown. A, The measurement of RWC was performed on leaves 4, 8, and 12 (counting from the apex) based on near-infrared reflectance. Values represent means of n = 4 ± se; dashed lines indicate the reference value of 80% RWC. Highlighted areas represent the periods of drought and heat. B, The Ψmd measurements were performed during the last day of the third stress cycle in the PS scenario (S3) and after 7 d of recovery (R3). Values represent means of n = 4 ± se; dashed lines indicate Ψmd = −1.0 MPa. n/d, No data. The PS and CS scenarios were performed under elevated [CO2].

