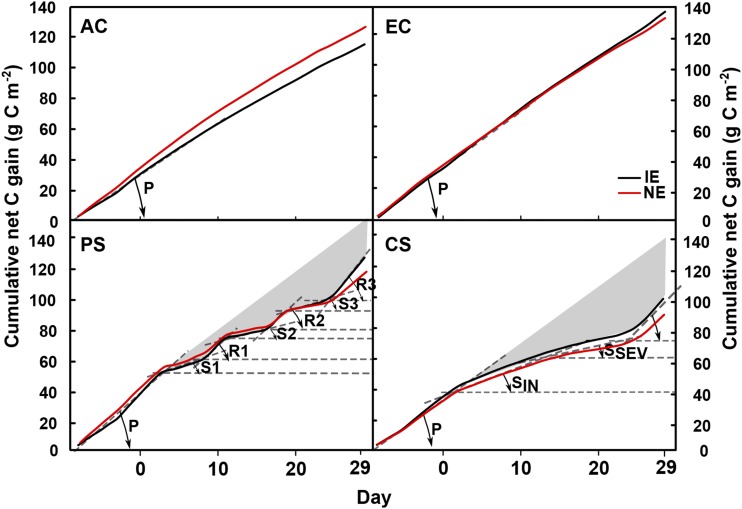
Figure 7.
Cumulative net C gain in IE (black lines) and NE (red lines) Grey poplar in the four scenarios (AC, EC, PS, and CS). Dashed lines represent auxiliary lines to calculate the angles between the x axis and the linear slope of each indicated phase. Different phases are indicated as exemplary for IE poplars. In the CS scenario, the phases are named as follows: P, prestress; SIN, stress initial; SSEV, stress severe; and R, recovery. The gray areas illustrate the C that the plants were not able to gain due to stress incidence.

