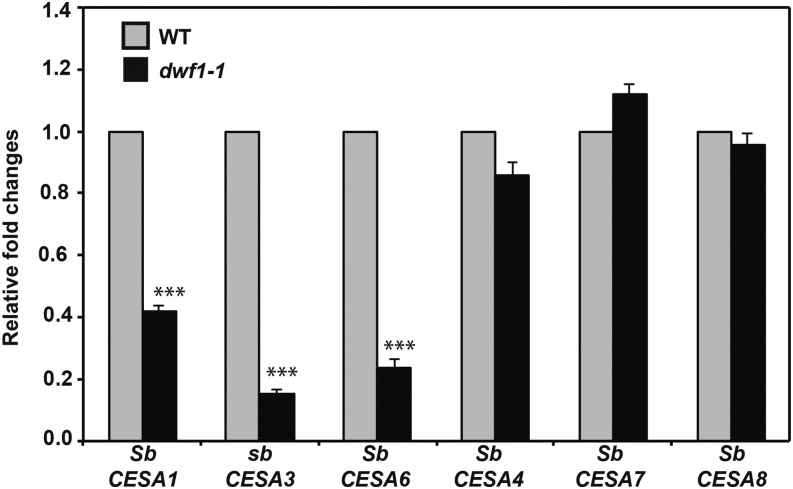
Figure 8.
Transcriptional analysis of Sorghum sp. CESAs. The relative expressions of primary and secondary cell wall SbCESA genes (Petti et al., 2013) were determined by quantitative reverse transcription-PCR in 14-d-old plantlets (aerial tissue) from the wild type (WT) and dwf1-1. Error bars indicate sem of three replicates. ***, Significance (P = 0.001).

