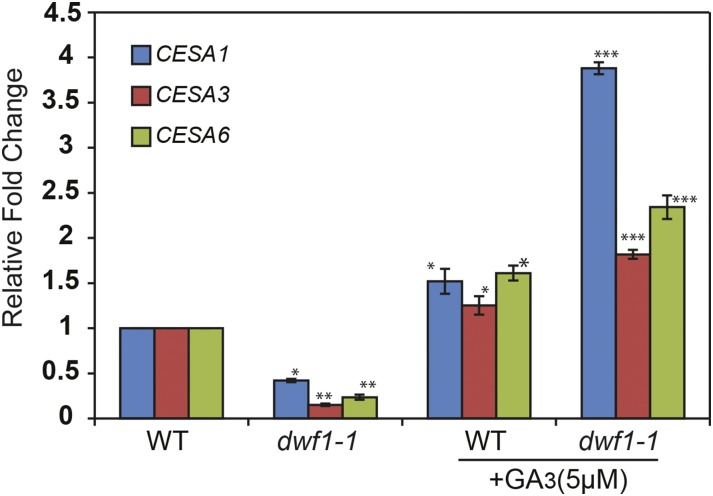
Figure 9.
Transcriptional analysis of Sorghum sp. CESAs after GA application. The relative expressions of primary cell wall SbCESA genes were determined by quantitative reverse transcription-PCR in 7- to 10-d-old plantlets (aerial tissue) from the wild type (WT) and dwf1-1 with and without GA3 addition. Error bars indicate sem of three replicates. Asterisks indicate significant difference. *, P = 0.05; **, P = 0.01; ***, P = 0001.

