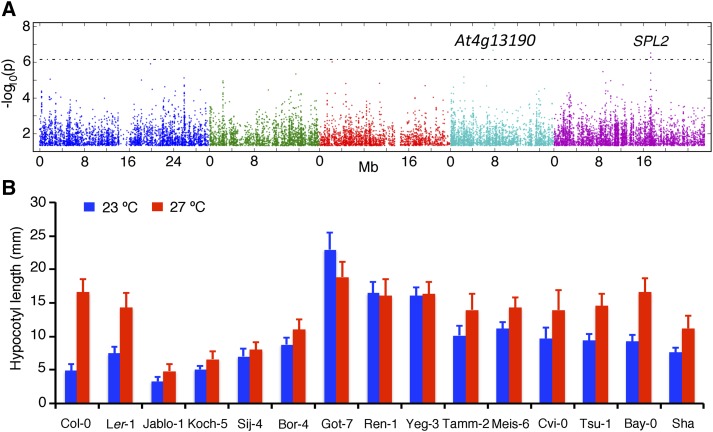
Figure 2.
Genome-wide association analysis and the identification of strains with reduced thermal response in hypocotyl elongation. A, Manhattan plots for genetic association for temperature sensitivity in hypocotyl elongation generated through the GWAS Web Application. The plot generated through linear regression is shown here. For other models, refer to Supplemental Figure S1. The position of the candidate gene SPL2 is shown. B, Hypocotyl elongation in accessions identified to be less responsive to ambient temperature changes including the parents of the RILs analyzed in this study.

