Figure 3.
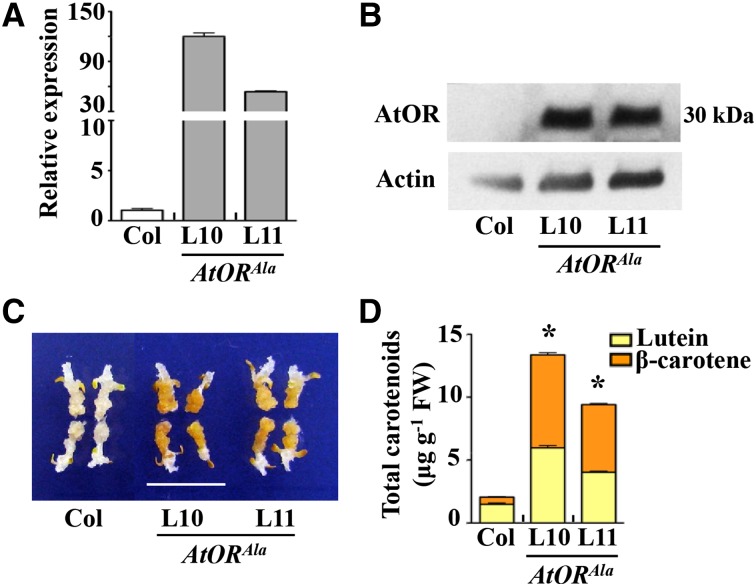
AtORAla-overexpressing transgenic lines accumulate high levels of total carotenoids in the calli. A, Relative expression levels of AtOR tested by qRT-PCR in the calli of Col and AtORAla lines. B, AtOR protein levels in the calli of Col and AtORAla lines. C, The callus color of Col and AtORAla lines. Bar = 1 cm. D, Total carotenoid levels in the calli of Col and AtORAla lines, measured by HPLC. *, Significant difference when compared with Col (P ≤ 0.05, n = 3).

