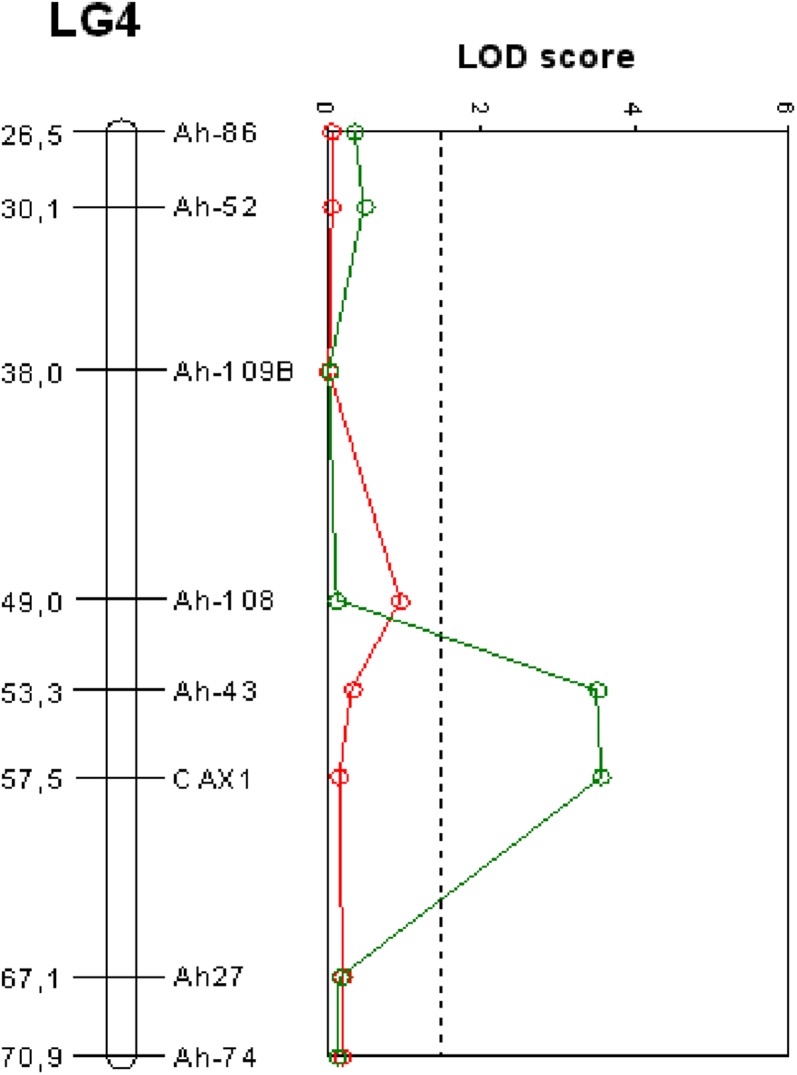
Figure 3.

QTL mapping of Cd tolerance in the CdTol2 region at two different Ca concentrations. Red line, LOD score obtained with 125 BC1 individuals phenotyped for Cd tolerance at 2 mm CaNO3 and genotyped for six markers in the CdTol2 region. Green line, LOD score obtained with the phenotyping at 0.5 mm CaNO3 (Courbot et al., 2007) and the six markers. The vertical dashed line represents the LOD score threshold for QTL detection at an error level of α = 0.05. LG4, LINKAGE GROUP4.
