
Figure 1. Structure of Ail determined by NMR in DePC micelles.
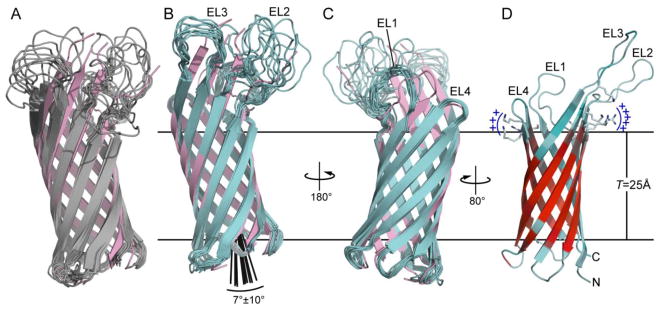
Structures were calculated using eefxPot (cyan) or REPEL (gray), or taken from the crystallographic coordinates (pink; PDB 3QRA). The eefxPot membrane is depicted as horizontal lines separated by the membrane thickness T=25Å. Each ensemble is aligned to its lowest energy structure. (A-C) Ensembles of 10 best structures calculated with REPEL (A) or eefxPot (B, C). The crystal structure is aligned to the lowest energy model of each ensemble. (D) Lowest energy structure from eefxPot, showing the four extracellular loops (EL1-EL4) and the two juxtaposed patches of positivley charged residues near the extracellular membrane surface. The red-cyan color spectrum reflects the 1H/2H exchange profile of amide hydrogens that resist (red) or undergo (cyan) exchange with solvent. Structures were rendered with PyMol (DeLano 2005)