
Figure 2.
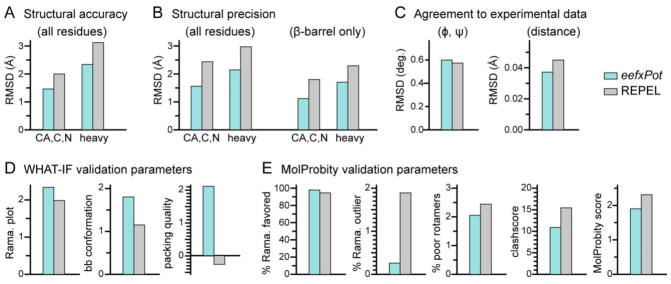
Structure statistics and validation metrics. Bars represent results obtained with eefxPot (cyan) or REPEL (gray). Statistics were evaluated for the ten structures in each refined ensemble. (A) Strucural accuracy evaluated as pairwise RMSD of backbone or heavy atoms between the calculated structures and the crystal structure (PDB: 3QRA). (B) Structural precision evaluated as average pairwise RMSD of backbone or heavy atoms, for all residues or β-barrel residues only. (C) Agreement between calculated structures and experimental dihedral angle (φ, ψ) and distance (NOE and H-bond) restraints. (D) WHAT-IF validation statistics for Ramachandran plot appearance, backbone conformation and protein packing quality. (E) MolProbity validation statistics for percent of residues in favored regions of the Ramachandran plot, percent of residues in unfavored regions of the Ramachandran plot, percent of residues with poor sidechain torsion angles, clashscore, and overall Molprobity score. The MolProbity clashscore and MolProbity score are costs: the lower the better.