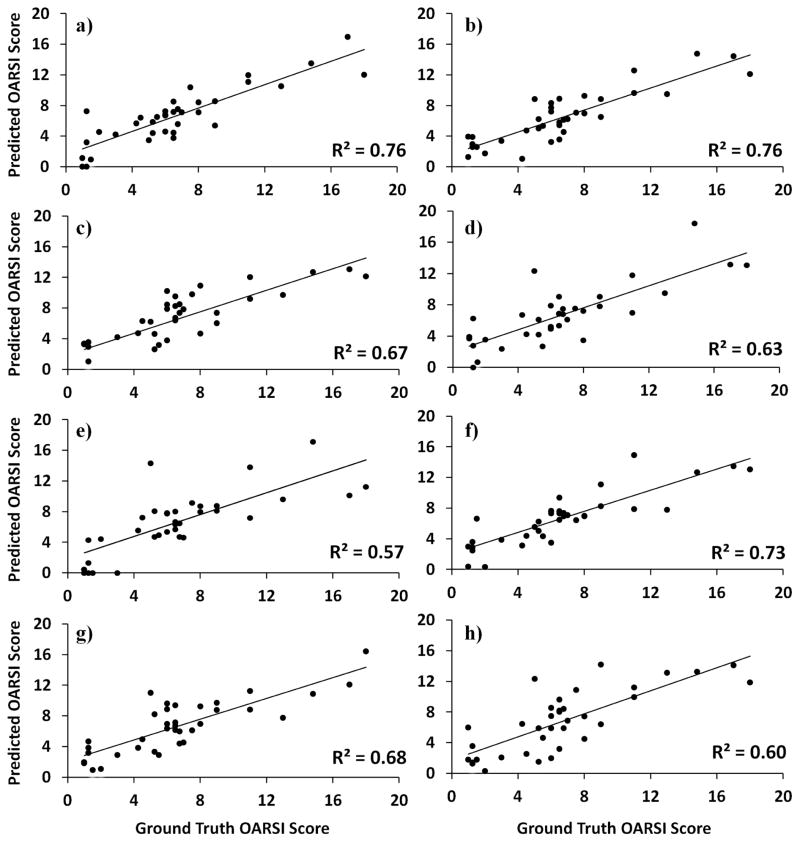
Figure 4.
Predicted OARSI score versus actual OARSI score for each sample as determined by the multiple regression for a) T1W (TR = 7.57 ms), b) T2W (TE = 10 ms), c) T2W (TE = 20 ms), d) T2W (TE = 30 ms), e) T2W (TE = 40 ms), f) T2W (TE = 50 ms), g) T2W (TE = 60 ms), h) T2W (TE = 70 ms). R2 values for each scan type are listed on the respective graphs.

