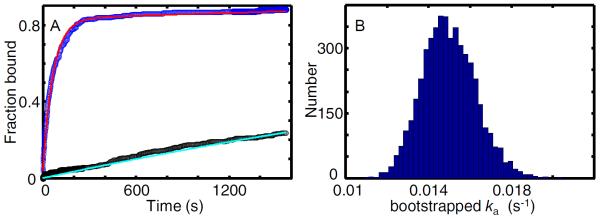
Figure 10. Association kinetics of GreB with transcription elongation complexes.

(A) Cumulative fractions of surface-tethered elongation complex targets (blue; N = 287) and control sites (black; Nc = 382) at which GreB (0.5 nM) co-localized at least once prior to the indicated time. Fitting (see text) was used to calculate model curves based on Eq. 5 (red; ka = (1.49 ± 0.13) × 10−2 s−1 and Af = 0.83 ± 0.02) and an exponential probability density function (cyan; kns = (1.75 ± 0.19) × 10−4 s−1). (B) Estimated uncertainty in ka. The plot is a histogram of ka values derived from fitting 5,000 bootstrap samples of the data in (A). The standard deviation of these values (0.13 × 10⁻² s−1) is the estimated standard error of ka reported in (A).
