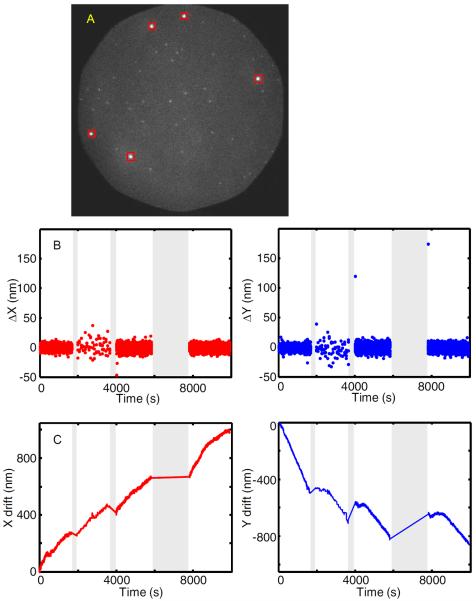
Figure 4. Drift correction.
(A) Spots from bright fluorescent beads (40 nm diameter TransFluoSpheres, Life Technologies, T10711) marked by squares are readily distinguishable from fluorescence of single dye molecules on a DNA oligonucleotide used to detect a nascent transcript by hybridization (unmarked spots). (B) Plots of the drift table data Δx and Δy against time. Images were recorded using four 0.24 s duration frames every 100 s between time 1950 – 3630 s and recorded continuously using frames of duration 1 s elsewhere. Interruptions in the drift table (gray) are intervals when image acquisition was temporarily suspended. (C) Integrals of the drift table which display the net drift in x and y.

