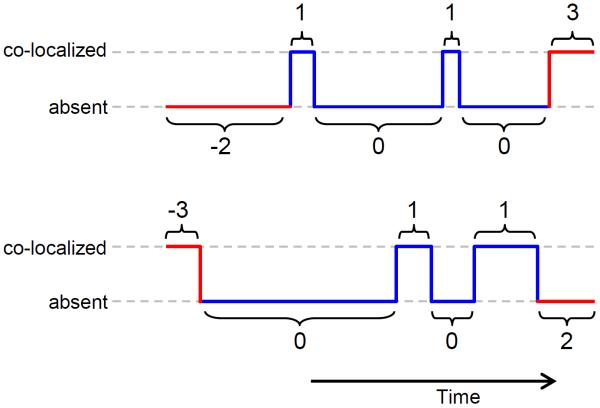
Figure 7. Coding binding interval data.
Plots illustrate two schematic data records consisting of alternating binder co-localization (top brackets) and binder absent (bottom brackets) intervals. Co-localization and absent intervals are coded as −3 and −2 respectively when they are the first (or only) interval in a record, 3 and 2 when they are the last interval in a record and 1 and 0 elsewhere.

