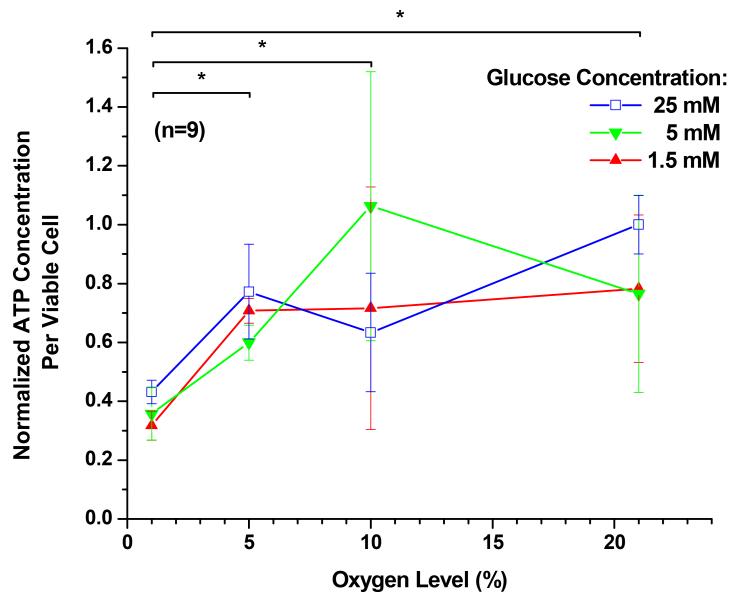
Figure 3.
The measurement of ATP per viable cell of porcine TMJ disc cells. The data shown were means and 95% confidence intervals. Experiments were performed in triplicate on three independent experimental days (n=9). The total per viable cell based ATP production was calculated by normalizing to the WST-1 absorbance values. The total ATP production per viable cell was then normalized to the control (25 mM glucose and 21% oxygen level). The effects of oxygen levels (1%, 5%, 10%, and 21%) and glucose concentrations (1.5, 5, and 25 mM) were assessed. An increase of glucose concentration from 1.5 mM to 25 mM had no significant impact on the average ATP measurement (P = 0.1388). In the presence of each of the glucose concentrations, an increase of oxygen level significantly increased intra- and extracellular ATP production (P < 0.0001). The interaction between oxygen and glucose was significant (P = 0.00015). Significance (P < 0.05) of oxygen level effect is denoted by a *.

