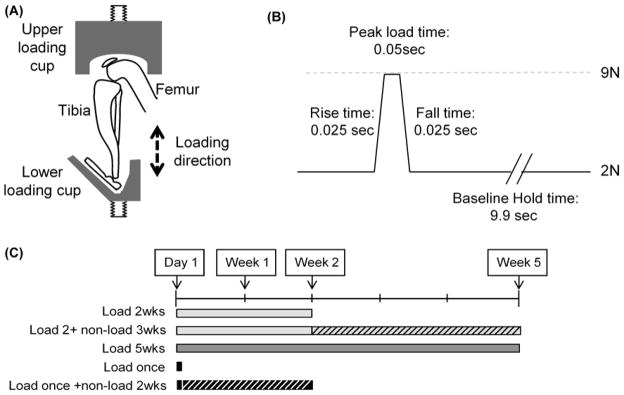
Figure 4.

Diagrammatic representation of the cyclic tibial compression loading model. (A) Estimated position of the hind limb and loading direction when placed in the loading apparatus. (B) Diagram of a single cycle of applied load, showing hold and peak load magnitudes, rate of load application, and intervening peak and baseline hold times. (C) Diagrammatic representation of the 5 different loading regimens. From Poulet et al. [80]. Used with permission.
