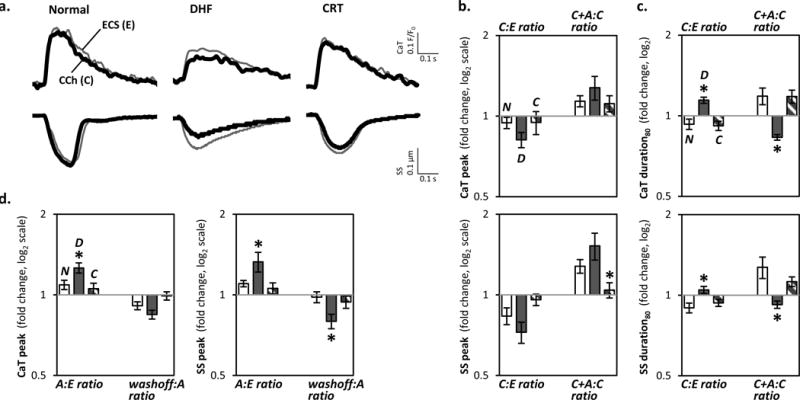
Figure 4. Response to cholinergic stimulation alone.

a. Representative CaT and SS are shown from normal controls, DHF, and CRT myocytes sequentially exposed to standard Tyrode’s extracellular solution [(ECS; E), thin gray line] followed by CCh [(C), thick black line].
b. The ratio of the peak responses for C:E and after the addition of atropine to CCh compared to CCh alone (C+A:C) for CaT (top panel) and SS (bottom) in normal control (empty bar), DHF (filled) and CRT (striped) myocytes is plotted in a format similar to Figure 3b (n=20–30 myocytes/bar; N=6–9 hearts/bar). The individual data points are plotted in Online Figure IVa. Cholinergic stimulation decreased the respective peak CaT and SS by 18±5% and 27±7% in DHF but had little or no effect in normal and CRT myocytes. These effects were reversed by subsequent addition of atropine.
c. The ratio of the 80% duration of CaT and SS are plotted in a format similar to panel b. The individual data points are plotted in Online Figure IVb. Cholinergic stimulation prolonged the CaT and SS durations by 14±3% and 5±3% in DHF whereas in normal and CRT myocytes, the CaT and SS durations was either shortened or unchanged.
d. The ratio of the peak responses to atropine (A:E) and washout for CaT (top panel) and SS (bottom) in normal control (empty bar), DHF (filled) and CRT (striped) myocytes is plotted in a format similar to panel b (n=8 myocytes/bar; N=3 hearts/bar). Atropine increased the peak CaT (left panel) and SS (right) by 26±5% and 33±11% in DHF, and by 9±4% and 10±3% in normal controls, but had no effect in CRT myocytes. These effects were reversed by washing off atropine.
In all panels of this figure, *p<0.05 vs. all other groups.
