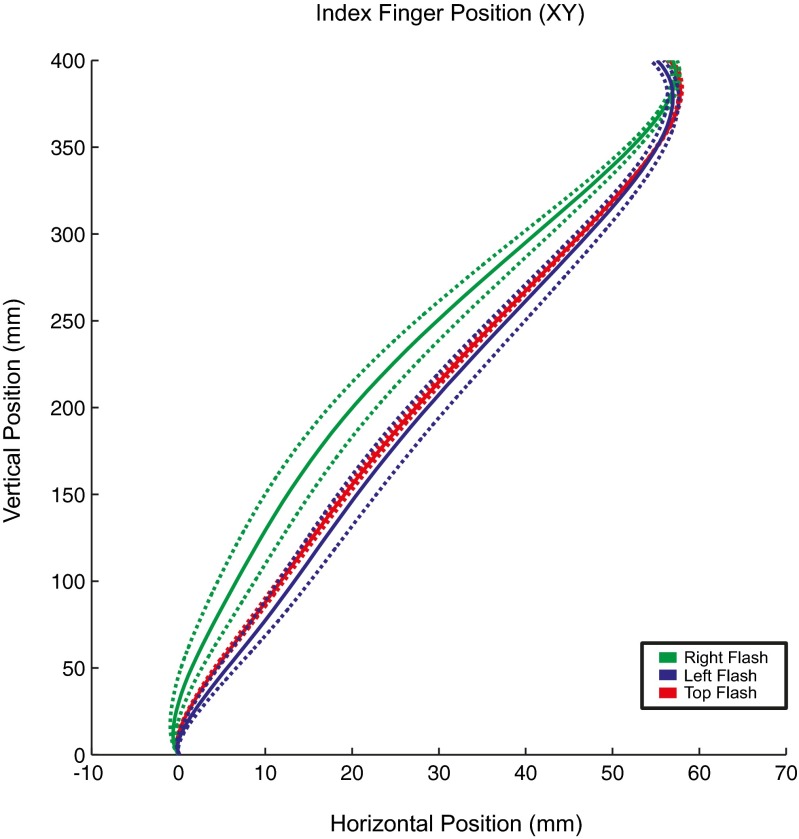
Fig. 2.
Mean trajectories of the index finger for Experiment 1. Mean movement trajectories were calculated across participants in the x, y plane. Solid lines represent the mean trajectories for reaches, whereas dotted lines represent the between-subjects standard errors of the means, which have been corrected for repeated measures by using the Cousineau (2005) method. Line is used to depict the different conditions, in which the left, right, or top obstacle LEDs were flashed. Please note that the endpoint of the reach is near the edge of the target object, which means that half the width of the object and the whole width of the finger “inflate” this endpoint.

