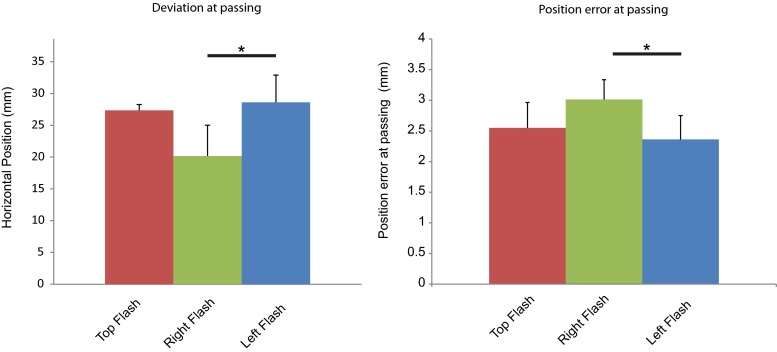
Fig. 3.
Detailed main effects in Experiment 1. Bar charts show the mean deviation at passing and the mean position error at passing. Error bars show the standard errors of the means. Asterisks denote significant paired t tests (Bonferroni-corrected). Line is used to depict conditions in which the left, right, or top obstacle LEDs were flashed.

