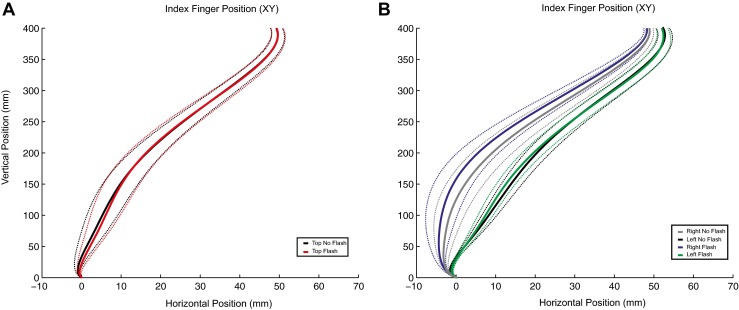
Fig. 4.

Mean trajectories of the index finger for Experiment 2. Mean movement trajectories were calculated across participants in the x, y plane. Solid lines represent the mean trajectories for reaches, whereas dotted lines represent the between-subjects standard errors of the means, which have been corrected for repeated measures by using the Cousineau (2005) method. Panel A shows reaches performed with two obstacles, whereas panel B shows reaches performed with a single obstacle, at either the left or the right of the workspace. In panel A, the trajectories for conditions in which no LEDs or both top obstacle LEDs were flashed are depicted. Panel B shows the results when the right or left top obstacle LEDs were flashed, as well as conditions in which there was no flash with an obstacle on the right or the left.
