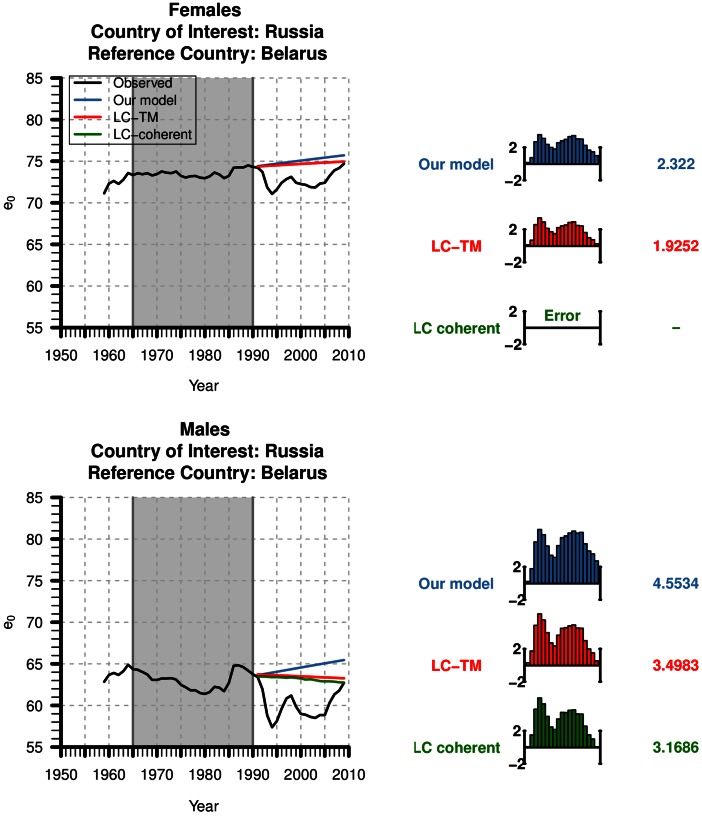
Fig. 7.
Left: Observed life expectancy at birth (black line) as well as its retrospective forecasts of our model (blue line), of the original Lee-Carter model (red line) and of its coherent variant (green line) for women (top) and men (bottom) in Russia. We take data from 1965 to 1990 (gray square) to forecast mortality from 1991 to 2009. Center: Annual forecast errors for each model. Error indicates that forecasting models were run, but generated an error message. Right: Mean of the absolute forecast errors (MAE) over all forecast years for each model

