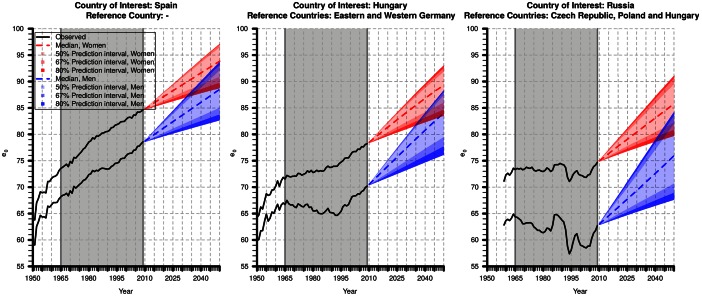
Fig. 9.
Observed (black) and forecasted life expectancy at birth of our model for women (red) and men (blue) in Spain (left), Hungary (center), and Russia (right). We take data from 1965 to 2009 (gray square) in order to forecast mortality from 2010 to 2050. The width of the 80, 67, and 50 % prediction intervals—which gradually lighten as they move toward the median point estimates (dashed lines)—gives an impression of how uncertain the future development of mortality is

