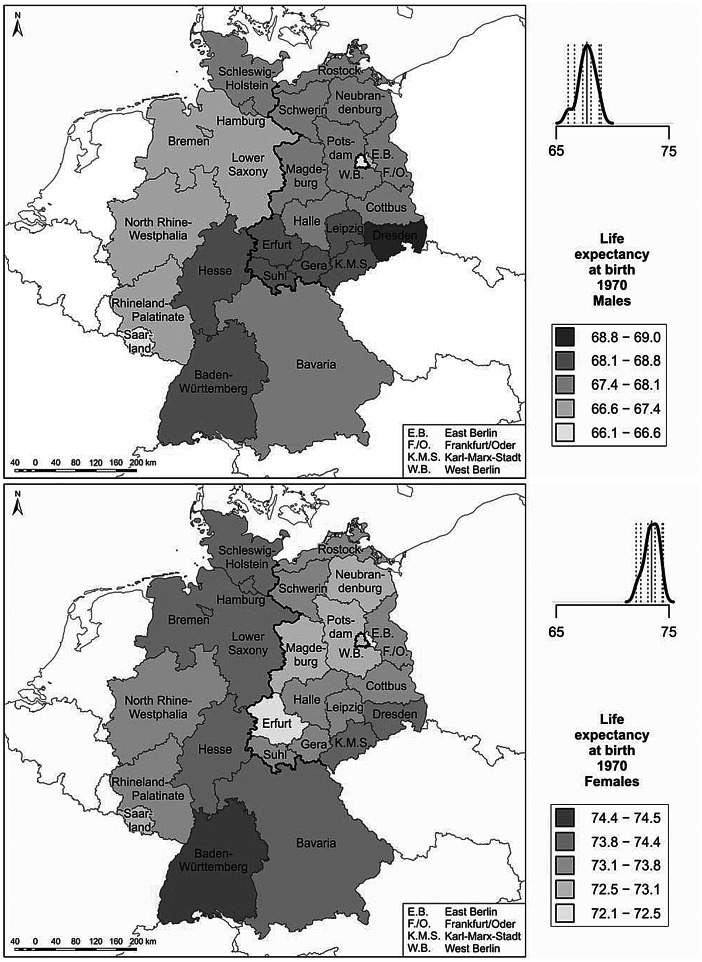
Fig. 3.
Life expectancy around 1970. (Source: Life tables were calculated by Statistisches Bundesamt 2012a; Ministerrat der DDR—Staatliche Zentralverwaltung für Statistik 1973. Base map: MPIDR 2014). Life expectancy values are shown for the West German Bundesländer for the period 1970–1972, and for the East German Bezirke for the period 1968–1971. The plot above the legend displays the density curve. In this graph the solid vertical line indicates the mean value, while the dotted vertical lines show the category breaks (based on a standard deviation classification centred on the mean)

