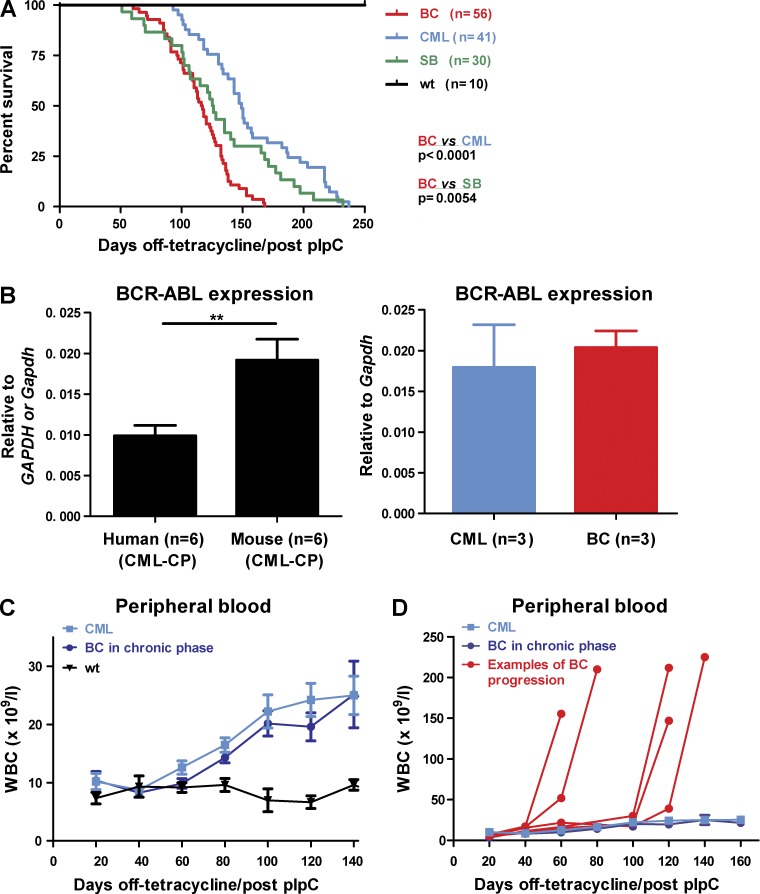
Figure 2.
Transposition leads to decreased survival and CML progression. (A) Kaplan-Meier curves showing survival of BC (n = 56) mice compared with CML (n = 41; P < 0.0001), SB (n = 30; P < 0.0054), and WT (n = 10; P < 0.0001) mice. Log-rank test was used. (B) BCR-ABL expression levels (n = 6 mice) were compared with human CML (n = 6 samples; left). BC (n = 3) and CML (n = 3) mice demonstrated similar levels of BCR-ABL expression throughout the study (right). Student’s t test was used. (C) Disease kinetics between CML and BC mice until the preterminal stages. Genotypic BC (dark blue) and CML mice (light blue) white blood counts (WBC) before transformation, when terminal bleeds for all groups of mice were excluded from the analysis (n = 8–26 mice at each time point). (D) Terminal WBC of representative BC cases (red) in comparison to CML mice (light blue). BC mice (by genotype) that remained in morphological chronic phase (dark blue) before sacrifice are shown for comparison (n = 1–26 mice at each time-point). Data are mean ± SEM. **, P < 0.01.

