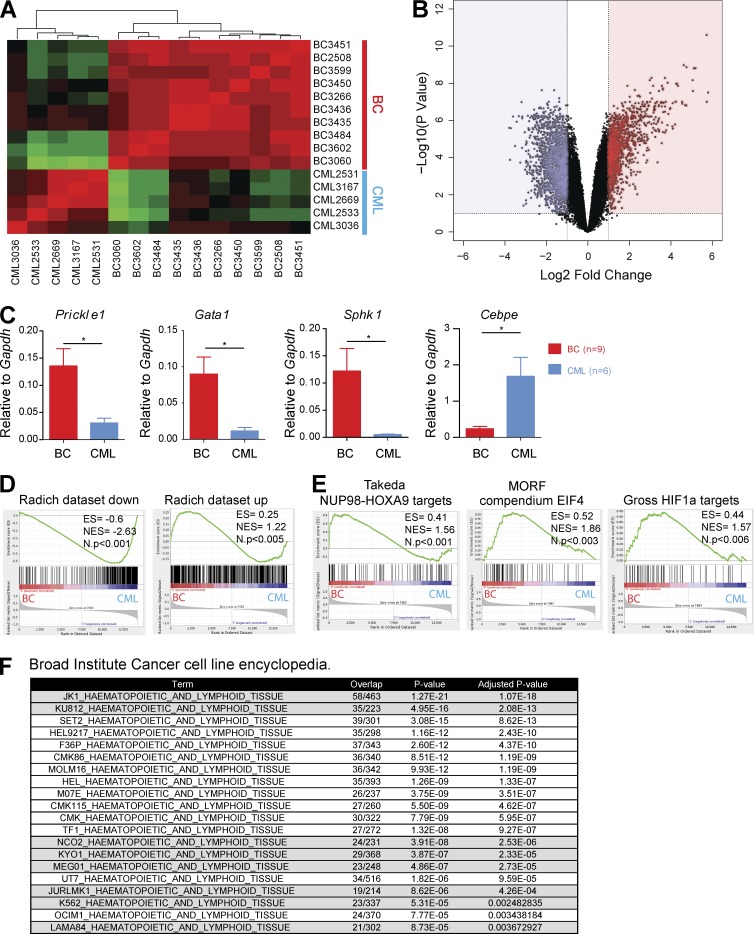
Figure 5.
Progression to BC generates gene expression profiles that are comparable to human blast crisis. (A) Unsupervised hierarchical clustering of gene expression data between CML (n = 5) and BC (n = 10) cases. (B) Volcano plot for BC (n = 10) versus CML (n = 5) samples showing fold change (log2) and p-value significance (−log10) for all genes. (C) Levels of expression for several genes previously identified to be involved in CML progression were validated by qPCR (n = 9 for BC; n = 6 for CML). Data are representative of at least three independent experiments. Student’s t test was used. (D) GSEA plots comparing our gene expression signature to that of a previously published human CML BC dataset. Genes down-regulated during human BC progression (Radich dataset down) and genes up-regulated during human BC progression (Radich dataset up). (E) GSEA plots showing enrichment of previously reported genes/pathways in CML progression including targets of NUP98-HOXA9, HIF1a, and EIF4 in our dataset. (F) The EnrichR tool enabled comparison of our BC up-regulated genes against a gene-set library of genes highly expressed in cancer cell lines from the CCLE database. A significant proportion (40%) of cell lines with a significant overlap of up-regulated genes were CML BC cell lines. Data are mean ± SEM. *, P < 0.05.

