Figure 6.
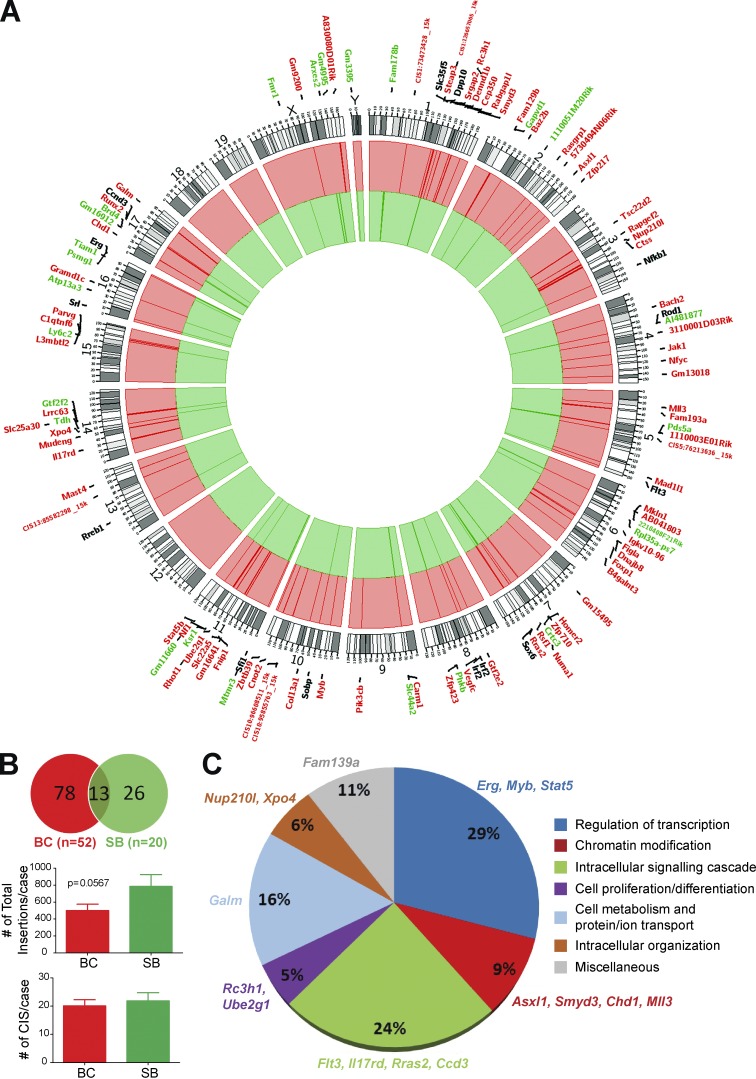
Common insertion sites (CISs) in CML BC progression. (A) Circos plot of CISs in the BC (red) and SB (green) cohorts. Genes annotated in black were common to both cohorts. Note: chromosome 19 (the transposon donor) was analyzed separately and is not represented in this plot. (B) Pie chart of the CISs between the BC and SB groups. Bar graphs of the number of CISs per sample and the number of total insertion events between BC mice and SB mice. Student’s t test was used. (C) Functional annotation of the BC CISs according to their gene ontology term. BC (n = 52); SB (n = 20). Data are mean ± SEM. *, P < 0.05; ***, P < 0.0001.

