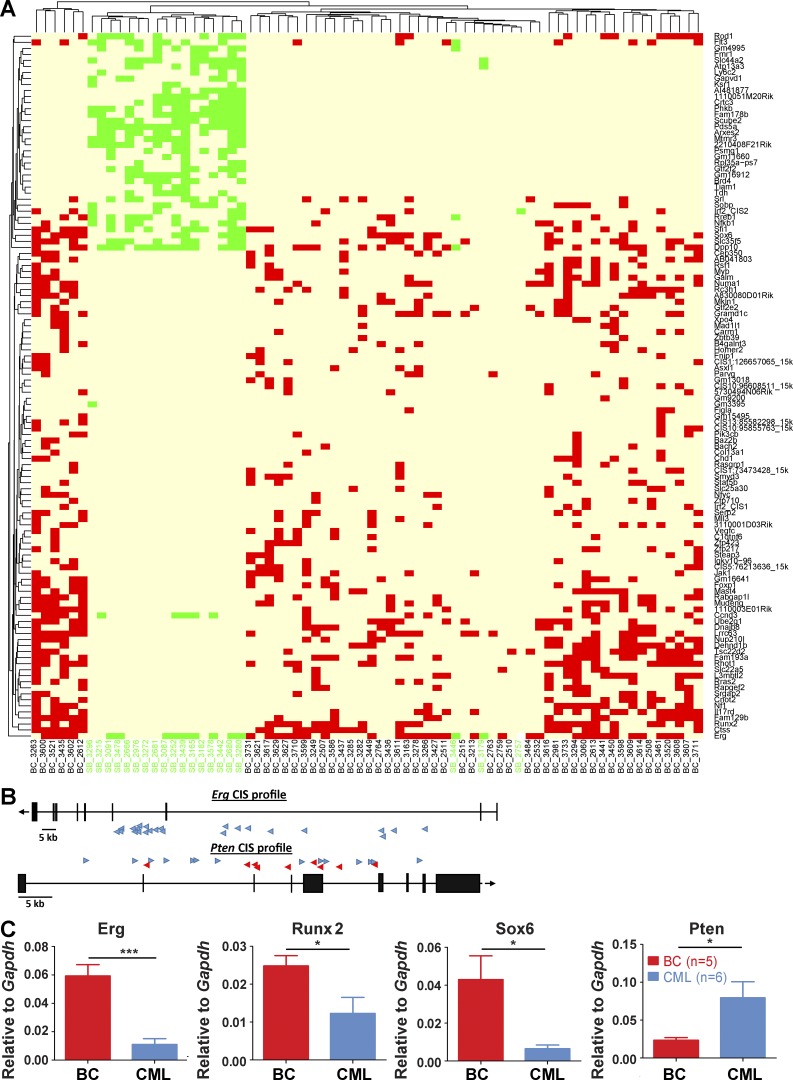
Figure 7.
Transposition leads to transcriptional deregulation and a distinct mutational signature in the BC cohort. (A) Unsupervised analysis of BC (n = 52) and SB (n = 20) insertion profiles by Euclidean distance, based on insertion number and identity. Each column represents an individual case with BC insertions in red and SB in green. (B) Insertions in the Erg gene were all found in the sense strand (blue arrows), strong indication of activating events. Conversely, insertions on the Pten gene were found in both strands (anti-sense strand in red arrows), suggesting inactivation of this gene. (C) Gene expression levels of selected CIS genes were investigated by qRT-PCR (BC, n = 5; CML, n = 6). Data are representative of at least three independent experiments. Student’s t test was used. Data are mean ± SEM. *, P < 0.05; ***, P < 0.0001.

