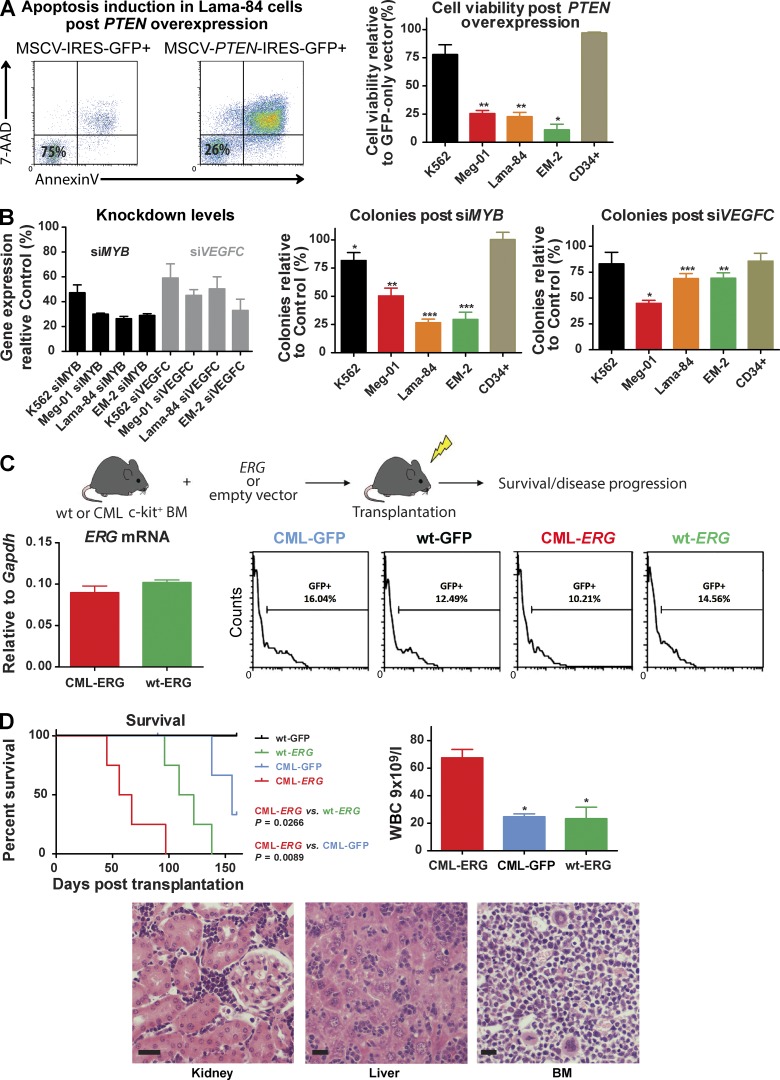
Figure 8.
Functional validation of CISs candidates. (A) Representative FACS plots and bar charts showing apoptosis induction levels in BC cell lines and normal CD34+ cells, 72 h after retroviral overexpression of PTEN. (B) siRNA-mediated knockdown of MYB or VEGFC effects on colony formation in BC cell lines. (C) Schema of experimental plan. WT or BCR-ABL+ c-kit+ HSPC cells were retrovirally transduced with ERG (or empty vector control) and transplanted into sublethally irradiated congenic recipients. The recipient mice were placed on tumor watch. ERG mRNA levels of CML-ERG and WT-ERG transduced cells (left). Engraftment levels across the four experimental cohorts in the early points after transplantation, as indicated by percentage of GFP+ cells (right). (D) Kaplan-Meier survival curves of CML-ERG (n = 4), CML-GFP (n = 4; P < 0.01) and WT-ERG (n = 4; P < 0.05) mice. Log-rank test was used. Bar charts of terminal white blood counts (Student’s t test was used) and representative photomicrographs of spleen, liver, and BM. Bar, 25 µM. Graphs in A and B represent three independent experiments. Student’s t test was used. Data are mean ± SEM. *, P < 0.05; **, P < 0.01; ***, P < 0.0001.

