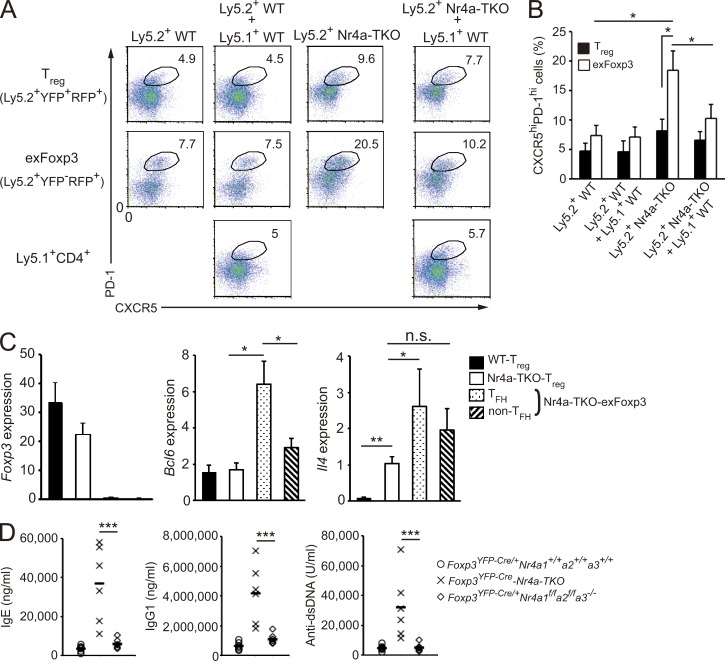
Figure 10.
GC reaction–inducing ability of Nr4a-deficient T reg cells is suppressed by coexisting WT T reg cells. (A) Flow cytometry of spleen T reg (CD4+YFP+RFP+) and exFoxp3 (CD4+YFP−RFP+) cells from Fig. 9 A. Co-transferred Ly5.1 total CD4+ T cells are also shown. The definition of the CXCR5hiPD-1hi Tfh gating is shown in Fig. S1 C. (B) Quantification of results in A. Frequencies of CXCR5hiPD-1hi cells among T reg and exFoxp3 cells (n = 5 mice per group, pooled from 2 independent experiments). Numbers adjacent to outlined areas indicate the percentage of cells in each. (C) qRT-PCR analysis of Foxp3, Bcl-6, and Il4 mRNA in the indicated cells. WT T reg cells were isolated from mice that had received Ly5.2+ WT T reg cells. Nr4a-TKO T reg (Ly5.2+YFP+RFP+), Nr4a-TKO exFoxp3 cells in the Tfh fraction (Ly5.2+YFP−RFP+CXCR5hiPD-1hi), and Nr4a-TKO exFoxp3 cells in the non-Tfh fraction (Ly5.2+YFP−RFP+CXCR5lowPD-1low) were all isolated from the mice that had received only Ly5.2+ Nr4a-TKO T reg cells. Expression was normalized to Hprt levels. Shown are a representative result of two biological replicates, each performed in triplicate. (D) Titers of total IgE, IgG1, and anti–double-stranded DNA antibodies in sera from 5–7-wk-old Foxp3YFP-Cre/+Nr4a1+/+Nr4a2+/+Nr4a3+/+, Foxp3YFP-Cre-Nr4a-TKO, and Foxp3YFP-Cre/+Nr4a1f/fNr4a2f/fNr4a3−/− mice (n = 6 mice per genotype, pooled from 4 independent cohorts per genotype). Each symbol represents an individual mouse; small horizontal lines indicate the mean. Error bars (B and C) denote mean ± SD. *, P < 0.05; **, P < 0.01; ***, P < 0.005 (one-way ANOVA with Bonferroni test).

