Figure 3.
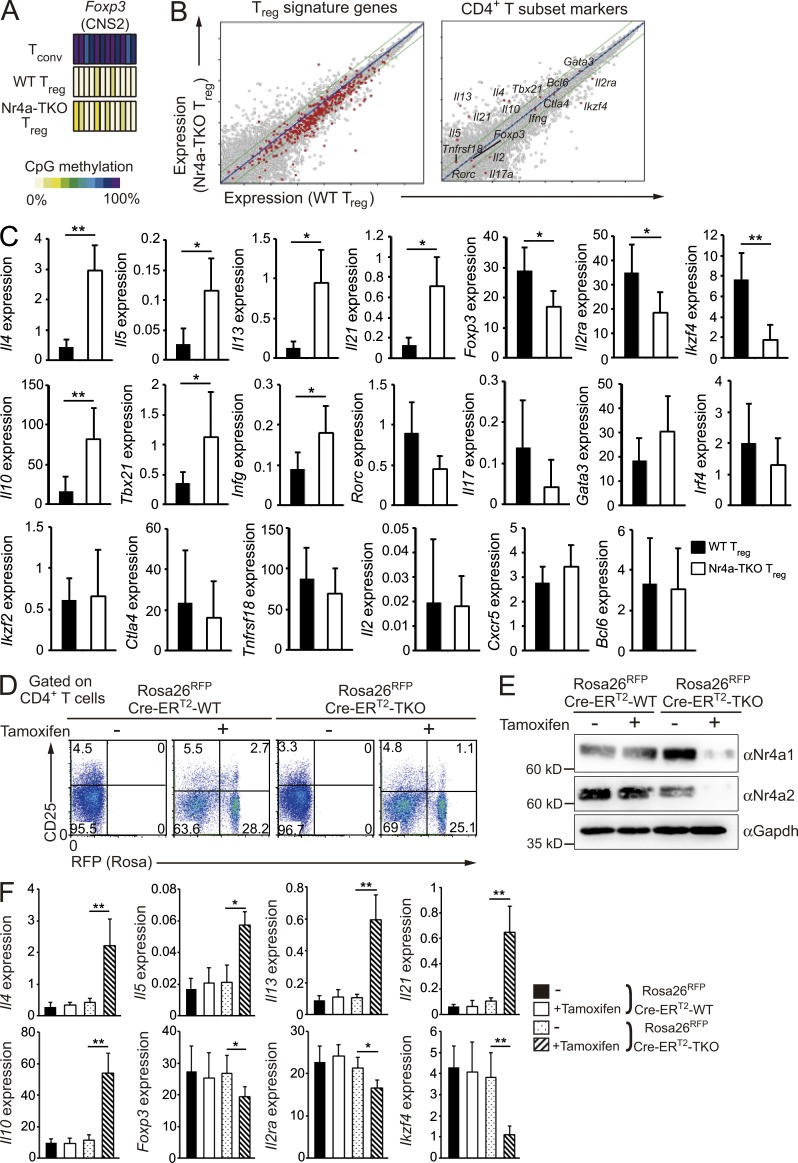
Dysregulation of T reg cell–associated transcription in Nr4a-TKO T reg cells. (A) CpG methylation profiles of T reg cell–specific demethylated sites at the Foxp3 CNS2 enhancer. (B) Expression profiles of WT T reg cells (horizontal axis) and Nr4a-TKO T reg cells (vertical axis) of the indicated groups of genes. (C) qRT-PCR analysis of the indicated genes in WT and Nr4a-TKO T reg cells from 4–6-wk-old mice. Results are presented relative to expression of the control gene Hprt (n = 10 mice per genotype, pooled from 7 independent cohorts per genotype). (D) Flow cytometry profiles of CD4+ cells from the peripheral bloods of Rosa26RFPCre-ERT2-WT and Rosa26RFPCre-ERT2-Nr4a-TKO mice, before and after tamoxifen treatment. Numbers indicate the percentage of cells in the indicated regions. (E) Immunoblot analysis of Nr4a1 and Nr4a2 in sorted T reg cells (CD4+CD25hiRFP+) from mice treated with tamoxifen, or in sorted T reg cells (CD4+CD25hi) from littermates treated with vehicle. (F) qRT-PCR analysis of mRNA for the indicated genes in T reg cells (CD4+CD25hiRFP+) from mice treated with tamoxifen, or in sorted T reg cells (CD4+CD25hi) from littermate mice treated with vehicle. Results are presented relative to expression of the control gene Hprt (n = 6 mice per genotype, pooled from 2 independent cohorts per genotype). Error bars denote mean ± SD. *, P < 0.05; **, P < 0.01 (Mann-Whitney tests [C], one-way ANOVA with Bonferroni test [F]).

