Figure 6.
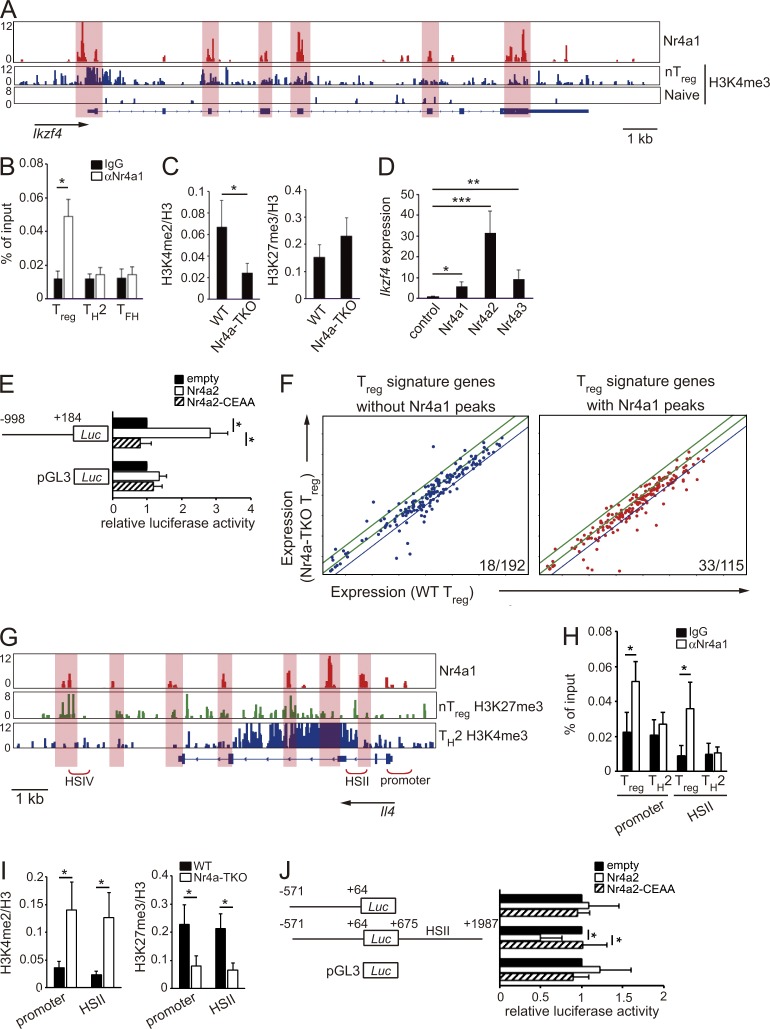
Direct repression of Il4 by Nr4a factors. (A) Genome browser view of ChIP-seq profile maps. The distribution of Nr4a1 bind sites on the Ikzf4 locus is shown for WT T reg cells. The distribution of H3K4me3 modification on Ikzf4 (Wei et al., 2009) are shown for nT reg and for T naive cells. Vertical scales are noted. (B) ChIP-qPCR analysis of the enrichment of Nr4a1 binding at the Ikzf4 promoter in WT T reg, Th2, and Tfh cells. Values are presented as the percentage of corresponding input. (C) ChIP-qPCR analysis of the Ikzf4 promoter region using chromatin extracts from WT and Nr4a-TKO T reg cells after immunoprecipitation with anti-H3K4me2 and anti-H3K27me3 antibodies. Results are presented relative to those obtained with antihistone H3 antibodies. (D) qRT-PCR analysis of Ikzf4 mRNA expression in naive CD4+ T cells transduced with a control retrovirus or Nr4a1-, Nr4a2-, or Nr4a3-expressing retroviruses. Expression was normalized to Hprt levels. Expression levels of control virus-transduced cells are set as one. (E) Luciferase reporter assays of a pGL3-control plasmid or an Ikzf4 reporter plasmid constructed from the Ikzf4 promoter region (−998 to +184). Promoter activity was analyzed in Jurkat cells transfected with empty plasmids or plasmids encoding WT Nr4a2 or a DNA binding-deficient form of Nr4a2 (Nr4a2-CEAA). Promoter activities are shown relative to those of empty plasmid-transfected cells. (F) Expression profiles of T reg signature genes in WT T reg cells (horizontal axis) and Nr4a-TKO T reg cells (vertical axis). The same microarray datasets that are shown in Fig. 3 B are highlighted for T reg signature genes, which were further divided according to the presence (right) or absence (left) of Nr4a1 peaks determined in the ChIP-seq analysis. Blue lines in each panel show the border of twofold down-regulation in Nr4a-TKO T reg cells, compared with WT T reg cells. Numbers in the each panel show the ratio of genes that showed more than twofold down-regulation in Nr4a-TKO T reg compared with WT T reg cells. (G) Nr4a1 occupancy in WT T reg cells, deposition of H3K27me3 in nT reg cells and H3K4me3 in Th2 cells (Wei et al., 2009) across the Il4 locus. Vertical scales are noted. (H) ChIP-qPCR with anti-Nr4a1 or control IgG antibodies in WT T reg and Th2 cells. Immunoprecipitated DNA was amplified with primers corresponding to the Il4 promoter and HSII regions. Values are presented as the percentage of corresponding input. (I) ChIP-qPCR of WT and Nr4a-TKO T reg cells; immunoprecipitation with antibodies for H3K4me2 or H3K27me3 was followed by qPCR analysis with primer sets corresponding to the indicated regions. Results are presented relative to those obtained with antihistone H3 antibodies. (J) Luciferase reporter assays. Reporter constructs of pGL3-control, and pGL3 linked with the Il4 promoter (−571 to +64) with or without a region encompassing HSII (+675 to +1987), were transfected into Jurkat cells, together with empty plasmids or plasmids encoding WT Nr4a2 or Nr4a2-CEAA. Promoter activities are shown relative to those of empty plasmid–transfected cells. Shown are representative results of three (B, C, E, and H–J) or four (D) biological replicates, each performed in triplicate, means ± SD. *, P < 0.05; **, P < 0.01; ***, P < 0.005, (Student’s t test [B, C, H, and I] one-way ANOVA with Bonferroni test [E and J]).

