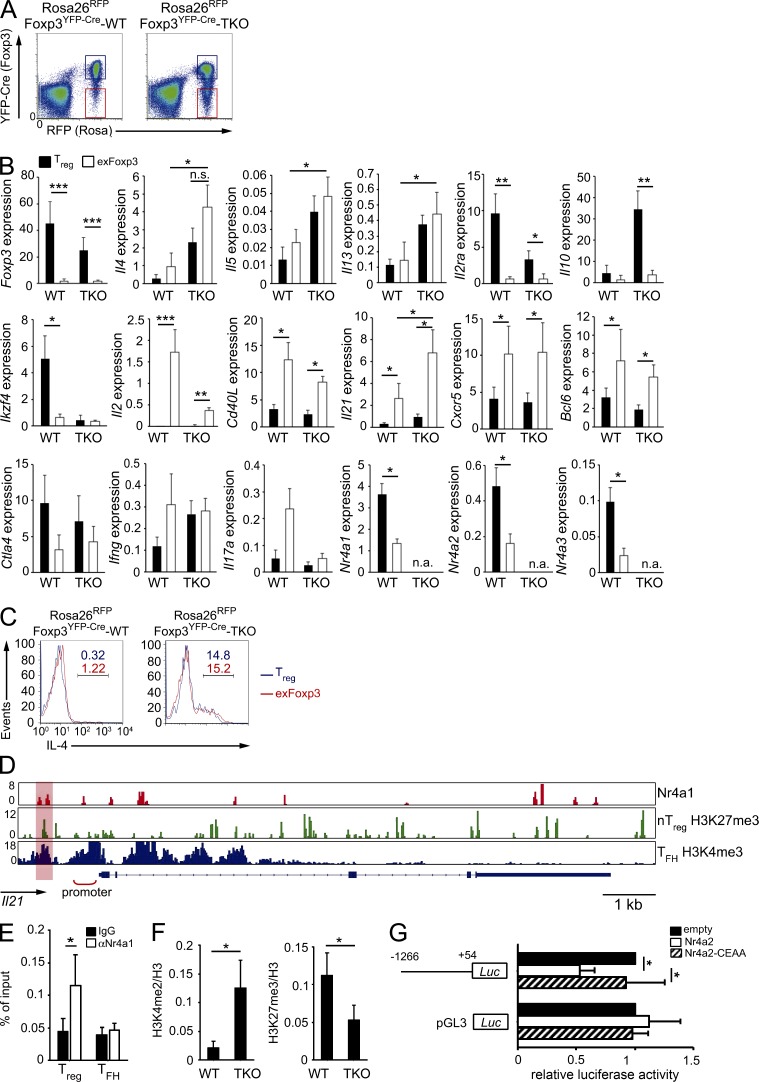
Figure 8.
Nr4a-deficient exFoxp3 cells acquire Th2 and Tfh effector-like gene expression patterns. (A) FACS profiles of peripheral CD4+ T cells from 7-wk-old Rosa26RFPFoxp3YFP-Cre-WT and Rosa26RFPFoxp3YFP-Cre-Nr4a-TKO mice. Cell populations denoted with blue and red lines were sorted as T reg cells and exFoxp3 cells, respectively, and further analyzed in experiments in B. (B) qRT-PCR analysis of the indicated mRNAs in T reg and exFoxp3 cells from 6–8-wk-old Rosa26RFPFoxp3YFP-Cre-WT and Rosa26RFPFoxp3YFP-Cre-Nr4a-TKO mice (n = 7 mice per genotype, pooled from 5 independent cohorts per genotype). n.a., not available. (C) Flow cytometric analysis of IL-4 expression in T reg (blue) and exFoxp3 (red) cells from 5-wk-old Rosa26RFPFoxp3YFP-Cre-WT and Rosa26RFPFoxp3YFP-Cre-Nr4a-TKO mice after 5 h stimulation with PMA plus ionomycin in the presence Brefeldin A. Blue (T reg) and red (exFoxp3) numbers indicate the percentage of cells in the indicated area. (D) Nr4a1 occupancy in WT T reg cells, deposition of H3K27me3 in nT reg cells (Wei et al., 2009) and H3K4me3 in Tfh cells (Lu et al., 2011) across the Il21 locus. Vertical scales are noted. (E) ChIP-qPCR analysis of Nr4a1 binding 1,200 bp upstream of the Il21 transcriptional start site (highlighted region in D) in WT T reg and Tfh cells. (F) ChIP-qPCR analysis of the region 1,200 bp upstream of the Il21 transcriptional start site using chromatin extracts obtained from WT and Nr4a-TKO T reg cells immunoprecipitated with anti-H3K4me2 and anti-H3K27me3 antibodies. Results are presented relative to those obtained with antihistone H3 antibodies. Shown are means ± SD of three independent experiments, each performed in triplicate. (G) Luciferase reporter assays of a pGL3-control plasmid or an Il21 reporter plasmid constructed from the Il21 promoter region (−1266 to +54). Promoter activity was analyzed in Jurkat cells transfected with empty plasmids or plasmids encoding WT Nr4a2 or a DNA-binding deficient form of Nr4a2 (Nr4a2-CEAA). Promoter activities are shown relative to those of empty plasmid-transfected cells. Shown are a representative results of three (E and F) or four (G) biological replicates, each performed in triplicate, means ± SD. *, P < 0.05; **, P < 0.01; ***, P < 0.005 (Student’s t test [E and F], one-way ANOVA with Bonferroni test [B and G]).

