Figure 9.
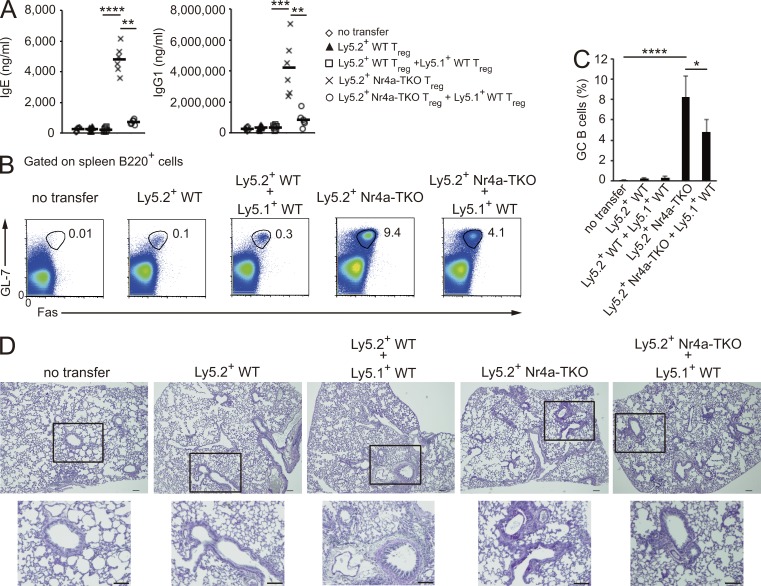
Nr4a-TKO T reg cells induce GC reactions. (A) Total IgE and IgG1 levels in recipient CD3ε-deficient mice transferred with no cells, Ly5.2+WT T reg cells (4 × 10⁵), or Ly5.2+Nr4a-TKO T reg cells (4 × 10⁵), with or without Ly5.1+ WT T reg cells (2 × 10⁵). Each symbol represents an individual mouse; small horizontal lines indicate the mean. (B) Flow cytometry profiles of B220+ spleen cells from A. Numbers adjacent to outlined areas indicate the percentage of cells in each. (C) Quantification of results in B. Frequencies of GL-7+Fas+ GC B cells among B220+ cells are shown (n = 5 mice per group, pooled from 2 independent experiments). (D) PAS staining of mucus-producing cells (pink) in the lungs of CD3ε-deficient mice from A. Outlined area is enlarged below. Bars, 100 µm. Error bars in C denote mean ± SD. *, P < 0.05; **, P < 0.01; ***, P < 0.005; ****, P < 0.001 (one-way ANOVA with Bonferroni test).

