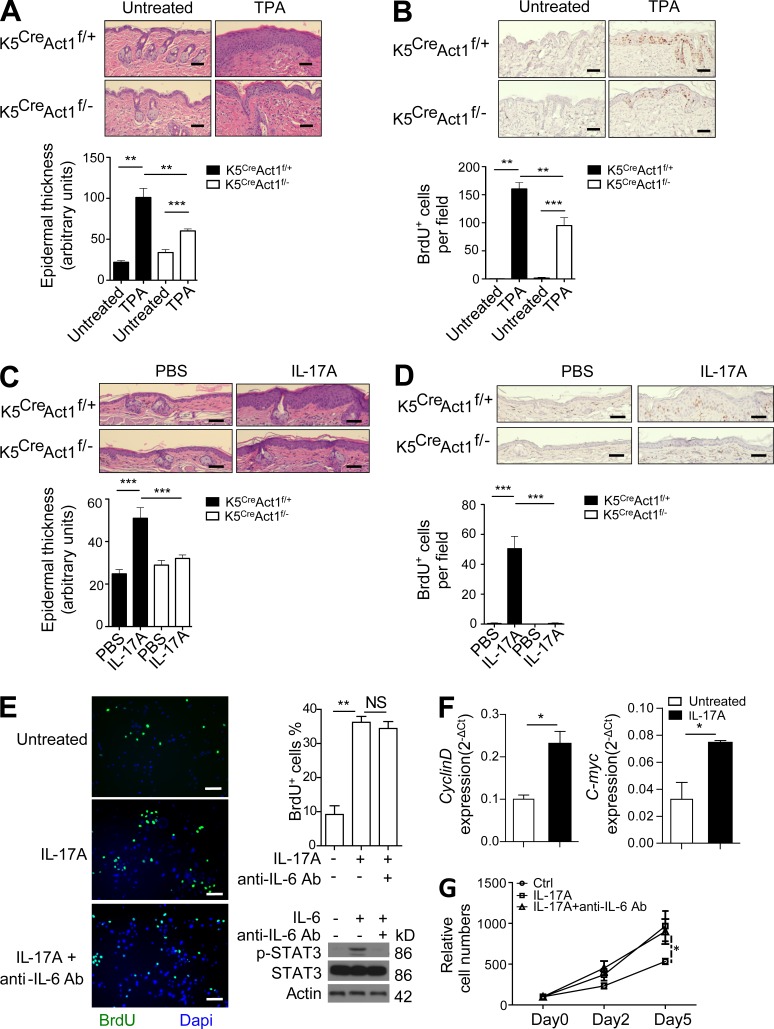
Figure 2.
IL-17 stimulation induces keratinocyte proliferation. (A) H&E staining of TPA-treated K5CreAct1f/− and K5CreAct1f/+ mice. (B) BrdU staining in mice treated as in A, with BrdU (100 µg per mouse) injected 24 h before tissue collection. (C) Ears of K5CreAct1f/− and K5CreAct1f/+ mice were injected intradermally either with IL-17A in PBS or PBS alone. H&E staining of PBS or IL-17A–injected ear sections of K5CreAct1f/− and K5Cre+Act1f/+ mice. (A and C) Graphs represent mean epidermal thickness in arbitrary units ± SEM. (D) BrdU staining of PBS or IL-17A–injected ear section of K5CreAct1f/− and K5CreAct1f/+ mice. (B and D) Graphs represent mean BrdU+ cells per 10× magnification field ± SEM. (E) Serum-starved primary keratinocytes left untreated or treated with IL-17A or IL-17A + 2 µg/ml anti–IL-6 neutralizing antibody for 24 h, with BrdU added during the last 2 h. Graph represents mean percentage of BrdU+ cells per 10× magnification field ± SEM. Western blot with the indicated antibodies using lysates from keratinocytes untreated or treated with IL-6 (50 ng/ml, 30 min) with or without the presence of 2 µg/ml IL-6 neutralizing antibody. Bars: (A–D) 50 µm; (E) 100 µm. (F) Gene expression of Cyclin D and c-myc in primary keratinocytes left untreated or treated with IL-17A ± SEM. (G) Primary keratinocytes left untreated or treated with IL-17A or IL-17A + 2 µg/ml anti–IL-6 neutralizing antibody for the indicated days, followed by counting of cells total cell numbers. Three replicates for each time point ± SEM are shown. For imaging analysis, five fields were analyzed. All the data are representative of at least three experiments. *, P < 0.05; **, P < 0.01; ***, P < 0.001.

