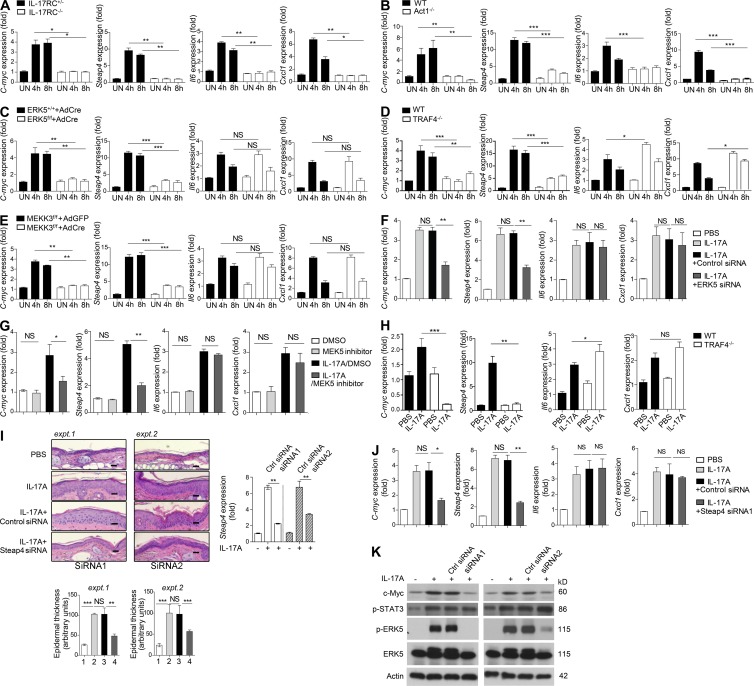
Figure 5.
The Act1–ERK5 axis mediates critical IL-17 target genes for keratinocyte proliferation. (A) Primary keratinocytes isolated from IL-17RC+/− or IL-17RC−/− mice were stimulated with IL-17A for the indicated times, followed by RT-PCR analysis. (B) Primary keratinocytes isolated from Act1 WT or Act1−/− mice were stimulated with IL-17A for the indicated times, followed by RT-PCR analysis. (C) Primary keratinocytes isolated from ERK5+/+ and ERK5f/f mice were infected with Cre-encoding adenovirus for 48 h before stimulation. Cells were then stimulated with IL-17A for the indicated times, followed by RT-PCR analysis. (D) Primary keratinocytes isolated from TRAF4 WT or TRAF4−/− mice were stimulated with IL-17A for the indicated times, followed by RT-PCR analysis. (E) Primary keratinocytes isolated from MEKK3f/f mice were infected with either Cre-encoding (AdCre) or empty adenovirus (AdGFP) for 48 h before stimulation. Cells were then stimulated with IL-17A for the indicated times, followed by RT-PCR analysis. (A–E) Gene expression is graphed as mean fold induction over untreated ± SEM. SEM was derived from three technical replicates. Data are representative of at least two independent experiments. (F and G) RNA isolated from the ear tissue of mice (with the same treatments as described in Fig. 3 B) was subjected to RT-PCR analysis. Gene expression is graphed as mean fold induction over PBS ± SEM. (H) RT-PCR analysis of the indicated genes isolated from the ear tissue of TRAF4 WT or TRAF4−/− mice injected with PBS or IL-17A. Gene expression is graphed as mean fold induction over PBS treated ± SEM. (F–H) SEM was derived from biological replicates (n = 5 mice). (I) H&E staining of ear skin sections from WT mice injected with PBS, IL-17A, IL-17A + control siRNA, or IL-17A + Steap4 siRNA (n = 5 mice each group). Bars, 50 µm. Graphs represent mean epidermal thickness (a.u.) ± SEM and were derived from five fields. Steap4 siRNA1 and Steap4 siRNA2 were used in experiments 1 and 2, respectively. Graph on the right shows RT-PCR analysis of Steap4 mRNA levels in the ear epidermis after IL-17A coinjection with control and Steap4 siRNA. (J) RNA isolated from the ear tissue of mice treated as in H using Steap4 siRNA1 was subjected to RT-PCR analysis. Gene expression is graphed as mean fold induction over PBS treated ± SEM. SEM was derived from biological replicates (n = 5 mice). (K) Western blot analysis of homogenized epidermal samples described in I. Student’s t test was used for all statistical analysis: *, P < 0.05; **, P < 0.01; ***, P < 0.001. All the data are representative of different independent experiments as described above.

