Figure 6.
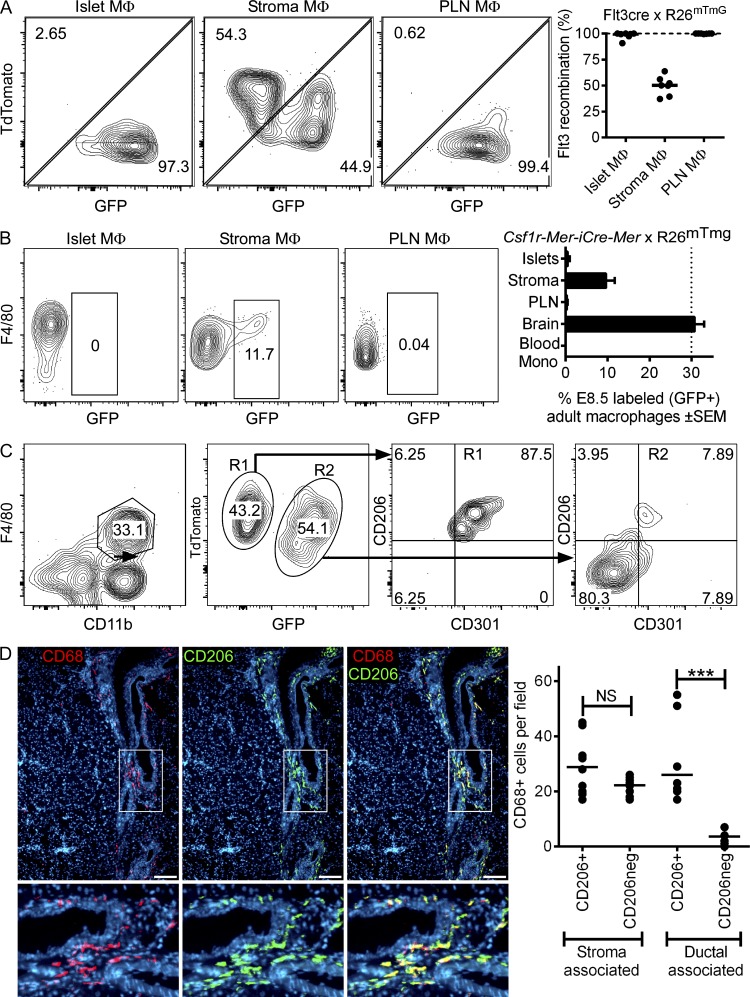
Ontogeny of pancreatic macrophages. (A) Flt3-cre × RosamTmG reporter mice (13–14 wk of age) were analyzed by flow cytometry and gated on singlets for CD45+ cells and macrophages (F4/80+ CD11b+) from islets, stroma, and PLNs to evaluate GFP and tdTomato (TdTom+) expression. Pooled results (right) from seven independent evaluations are shown. (B) Csf1r-Mer-iCre-Mer × RosamTmG reporter mice were gavaged with tamoxifen at E8.5 to label the progeny of yolk sac macrophages (TdTomato− GFP+). Islets, stroma, and PLN macrophages were evaluated at 10 wk of age to determine whether yolk sac progeny persisted into adulthood. Pooled results (right) from two experiments show the percentage of labeled (GFP+) macrophages (islets, stroma, and PLNs), brain microglia, and blood monocytes. Bars indicate the mean ± SEM. (C) Pancreatic stroma of Flt3-cre × RosamTmG reporter mice (13–14 wk of age) were analyzed by flow cytometry and gated on macrophages (F4/80+ CD11b+) for their TdTom+ or GFP+ expression (R1 and R2 gates, respectively) to evaluate CD206 and CD301 profiles. Data are representative of two independent experiments. (D) Immunofluorescence examination of pancreatic sections from 10-wk-old mice showing stromal macrophage distribution (stained for CD68 in red), their positive or negative expression for CD206 (green), and nuclear staining by DAPI (blue). Higher magnifications of the periductal area (boxes) are shown below. Images are representative of 8–10 sections from two examined mice. Bars, 100 µm. (right) Quantitative analysis showing distribution of CD206+ and CD206− macrophages in stroma and ductal-associated areas. Bars indicate the mean. P-values were calculated using the Mann–Whitney U test: ***, P < 0.001; NS, P ≥ 0.05.

