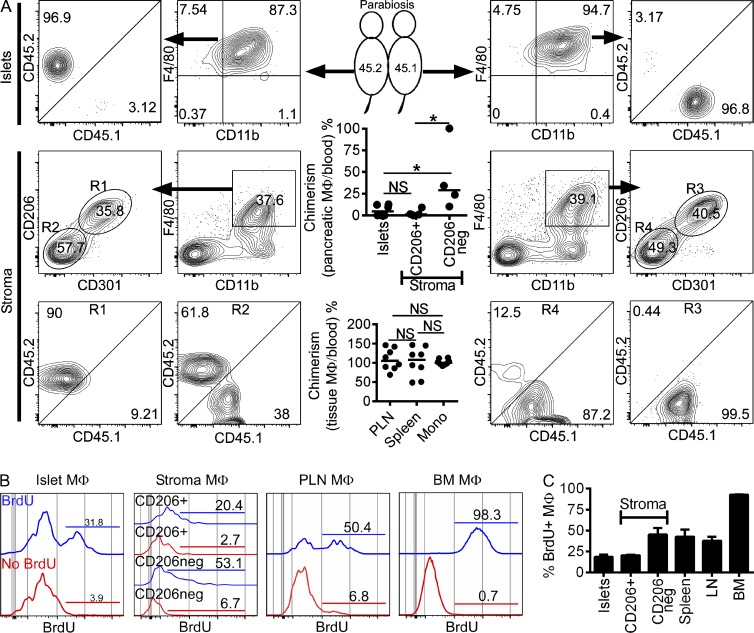
Figure 7.
Pancreatic macrophages after parabiosis and in situ maintenance. (A) Parabiotically joined CD45.2+ (left) and congenic CD45.1+ mice (right) were examined at 6 wk of parabiosis. Islets and stroma macrophages (gated on F4/80+ CD11b+, and CD206+ CD301+ or CD206− CD301− expression [R1 and R2 gates, respectively]: middle and bottom) along with their CD45.1+ or CD45.2+ expression are shown. The top scatter dot plot panel shows pooled quantitative pancreatic macrophage chimerism percentages at 6 wk of parabiosis for islet chimerism (total of 12 mice from three independent experiments, pooling 2 mice per parabiont side) and stromal CD206+ and CD206− macrophages (from two independent experiments using single parabionts). The bottom scatter dot plot panel shows pooled quantitative tissue macrophage chimerism percentages (PLNs and spleen) from the same experiments and compared with blood monocyte chimerism for each parabiont. Bars represent mean values. (B) Islet, pancreatic stroma (CD206+ and CD206−), PLN, and BM macrophage (MΦ) proliferation was assessed after 7 d of ad libitum BrdU treatment. Histograms of macrophages (gated on CD45+; F4/80+ and CD11b+) with or without BrdU treatment (blue and red histogram lines, respectively) are shown. Bars indicate percentages of BrdU incorporation. (C) Pooled results for BrdU incorporation as shown in B from three independent experiments. Bars indicate the mean ± SEM. P-values were calculated using the Mann–Whitney U test: *, P < 0.05; NS, P ≥ 0.05.

