Figure 3.
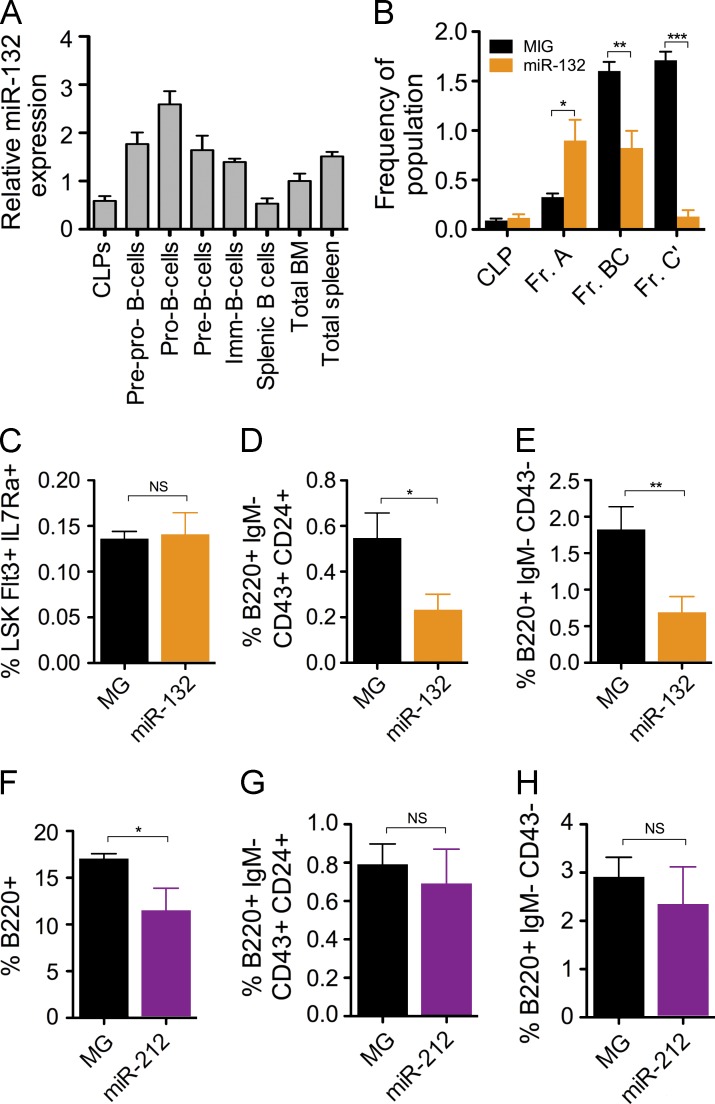
miR-132 causes a block in early B cell development. (A) miR-132 expression in various bone marrow B cell progenitor populations. Cells were sorted by FACS directly into RNA lysis buffer and miR-132 expression was detected using TaqMan RT-qPCR (n = 2). (B–E) Analysis of MG and miR-132 mice at 4 mo after reconstitution (n = 10–12 mice per group). (B) Hardy fractions for B cell progenitor populations in the bone marrow of MG and miR-132 mice. Populations were gated on lineage-negative cells (CD3, Ter119, Ly6C, Gr1, CD11b), and are presented as follows: CLP (lineage-CD19-CD24-CD43medCD93hiIgM-B220-cKit+IL7Ra+), Fr. A (prepro–B; lineage−B220+CD43+CD19−CD24−CD93+cKit+IL7Ra+), Fr. BC (pro–B; lineage−B220+CD43+CD19+CD24medCD93+), and Fr. C’ (pre–B; lineage−B220+CD43+CD19+CD24hiCD93+). (C) Frequency of CLPs using alternative surface markers (lineage−cKit+Sca1+Flt3+IL7Ra+) in the bone marrow MG and miR-132 mice. (D) Frequency of pro–B cells using alternative surface markers (B220+IgM−CD43+CD24+) in the bone marrow of MG and miR-132 mice. (E) Frequency of pre–B cells using alternative surface markers (B220+IgM−CD43−) in the bone marrow of MG and miR-132 mice. (F–H) WT C57BL/6 mice were lethally irradiated and reconstituted with donor HPSCs expressing either a control (MG) or a miR-212–overexpressing (miR-212) vector. Mice were analyzed at 4 mo after reconstitution (n = 4–5 mice per group). (F) Frequency of B cells (B220+) in the bone marrow of MG and miR-212 mice. (G) Frequency of pro–B cells (B220+IgM−CD43+CD24+) in the bone marrow of MG and miR-212 mice. (H) Frequency of pre–B cells (B220+IgM−CD43−) in the bone marrow of MG and miR-212 mice. Data represent at least two independent experiments and are represented as mean ± SEM. *, P < 0.05; **, P < 0.01; ***, P < 0.001, Student’s t test.

