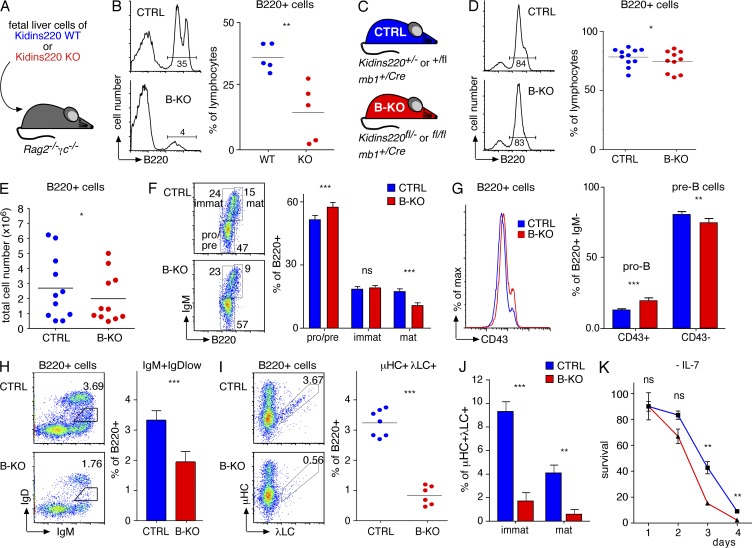
Figure 4.
Early B cell development in the BM. Kidins220 is required for the development of λ+ B cells. (A) Sublethally irradiated Rag−/−γc−/− mice were reconstituted with equal numbers of WT or Kidins220 KO fetal liver cells. (B) The percentage of B220+ cells in the BM of the reconstituted mice was measured by flow cytometry (two experimental repeats, n = 5). (C) The genotypes of CTRL and B cell–specific Kidins220 KO (B-KO) mice are depicted. (D) An analysis of the BM of CTRL and B-KO mice using the marker B220 (left) as well as its quantification is shown (right; eight experimental repeats, n = 10–11). (E) The total number of B220+ cells in the BM is shown (eight experimental repeats, n = 11). (F) B cell development in the BM of the CTRL and B-KO mice was analyzed using anti-B220 and anti-IgM antibodies (eight experimental repeats, n = 11). (G) BM cells from CTRL and B-KO mice were stained using anti-B220, anti-IgM, and anti-CD43 antibodies to analyze early B cell development (eight experimental repeats, n = 10–11). (H) BM cells as indicated were stained using anti-B220, anti-IgM, and anti-IgD antibodies to analyze the output of B cells from the BM (seven experimental repeats, n = 9). (I) CTRL and B-KO B220+ BM cells were analyzed for μHC and λLC expression (four experimental repeats, n > 6). (J) Percentages of μHC+λLC+ cells as in I in the B220+ immature and mature gates are shown. (K) BM cells from CTRL and B-KO mice were grown for 7 d ex vivo with IL-7. Subsequently, IL-7 was removed (day 0) and the cells cultured for another 4 d. The proportion of living cells was determined by flow cytometry according to FSC/SCC and normalized to day 0 (n > 3). In all graphs, the mean or mean ± SEM is plotted. Paired two-tailed Student’s t test (ns, P > 0.05; *, P < 0.05; **, P < 0.01; ***, P < 0.001).

