Figure 7.
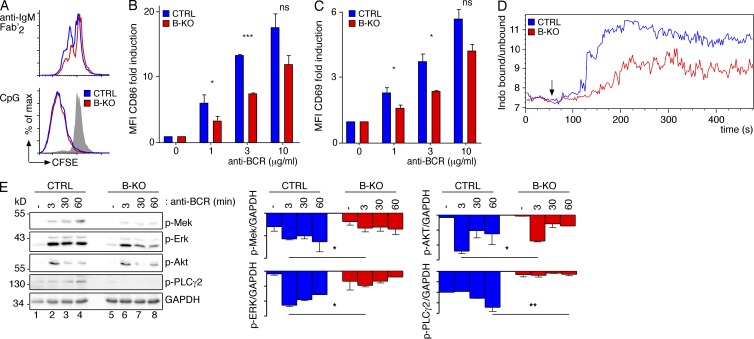
Kidins220 promotes signaling via the BCR in primary B cells. (A) CFSE-labeled splenic B cells from CTRL and B-KO mice were stimulated with 1 µg/ml anti-IgM Fab′2 fragments or 2.5 µg/ml CpG or left untreated (gray shaded). After 3 d the proliferation-induced dilution of the CFSE dye was measured by flow cytometry (three experimental repeats, n = 5). (B and C) Cells as in A were stimulated with anti-IgM Fab′2 fragments for 11 h and analyzed by flow cytometry using anti-CD86 (B) and anti-CD69 (C) antibodies. After normalization to the unstimulated cells, the fold induction of the mean fluorescent intensity (MFI) is shown (three experimental repeats, n = 5). (D) Ca2+ influx of the cells as in A was measured as in Fig. 2 D. Stimulation was induced with 1 µg/ml anti-IgM Fab′2 fragments (arrow; two experimental repeats). (E) Cells as in A were stimulated with 3 µg/ml anti-IgM Fab′2 fragments for the given time points and lysed, and proteins were separated by SDS-PAGE. Phospho-Mek, phospho-Erk, phospho-Akt, phospho-PLCγ2, and GAPDH were detected by WB (two to three experimental repeats). In all graphs, mean ± SEM is plotted. Paired two-tailed Student’s t test (ns, P > 0.05; *, P < 0.05; **, P < 0.01; ***, P < 0.001).

