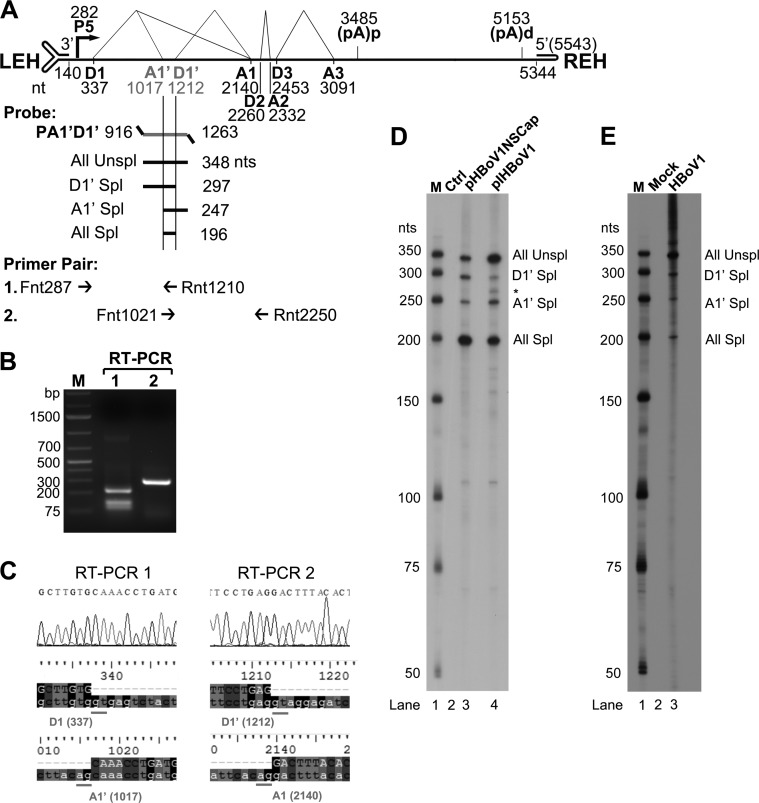
FIG 1.
HBoV1 pre-mRNA is processed at novel A1′ acceptor and D1′ donor sites. (A) Primers and probe used to detect viral mRNAs spliced at the A1′ and D1′ splice sites. The genome of HBoV1 is shown to scale, with transcription landmarks indicated, including the P5 promoter, splice donor (D1, D1′, D2, and D3) and acceptor (A1, A1′, A2, and A3) sites, the internal proximal polyadenylation site [(pA)p], and the distal polyadenylation site [(pA)d]. LEH, left end hairpin; REH, right end hairpin. The RPA probe PA1′D1′ (nt 916 to 1263) is shown, along with the designated bands that are expected to be protected and their predicted sizes (nt). Primers used for RT-PCR are also shown. (B and C) RT-PCR analyses of HBoV1 RNAs. Total RNA was isolated from HEK293 cells transfected with pHBoV1NSCap. cDNA was synthesized and amplified with two pairs of HBoV1-specific primers as shown. (B) Amplified DNA fragments were electrophoresed on 1.6% agarose gel and visualized using ethidium bromide staining. (C) The amplified DNA fragments were excised from the agarose gel and purified. The purified DNA was subjected to sequencing by the Sanger method. The histograms of the sequences at the exon junctions of D1/A1′ and D1′/A1 splice sites, with alignment of the sequences with the HBoV1 genome sequence (at the bottom), are shown. (D and E) Determination of the usage of the D1′ and A1′ splice sites by RPA. Ten micrograms of total RNA isolated at 2 days posttransfection from pBluescript SK (Ctrl) or pHBoV1NSCap- and pIHBoV1-transfected HEK293 cells (D) or at 14 days p.i. from mock- and HBoV1-infected HAE cells (E) was protected by the P1A1′D1′ probe as indicated. Lanes M contain 32P-labeled RNA markers (39), with sizes indicated to the left. The origins of the protected bands in the lanes are indicated to the right. Spl, spliced RNAs; Unspl, unspliced RNAs.

